DOW testing Support / Resistance Line

…The DOW broke below the 10,750 support line last week on the largest weekly volume (distribution volume) since October. It is making an attempt to recover the line today but is now using the level as resistance. Looking at the chart below, you can see how the 10,750 line has been used as support and resistance numerous times since early 2004. The price relative to the S&P 500 is still sitting at multi-year lows so don’t expect this index to lead the market any time soon and don’t place your analysis in the hands of a laggard index. Continue to monitor the NH-NL ratio which finished at 273-54 last night, well below the critical 500 new highs needed for a strong rally.

Looking at my monitor at 2:30pm:
The stocks in my portfolio are showing a profit.
The majority of the stocks on the MSW Index are in the black.

Today’s MSW % gain leaders (2:30pm):
(CTRN) – Citi Trends
(VIVO) – Meridian Bioscience
(CRDN) – Ceradyne
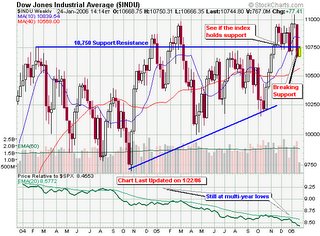
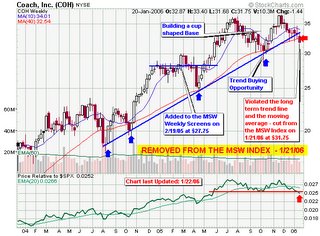
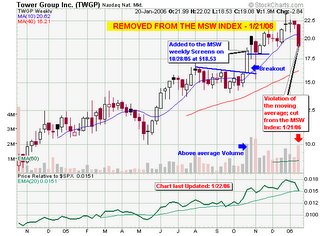
Image enlarges to “real size”.
– Piranha

Coach (COH) & Tower Group (TWGP) Removed

As you know, I removed both Coach (COH) and Tower Group (TWGP) from the MSW Index this weekend as they both violated moving average support lines. I will include the charts in this blog to highlight what I am seeing and why they were removed.

In the case of Coach, I have been a long time supporter of the stock with coverage going back to early last year but it is turning into a laggard compared to the other leaders. I said it was a sell with a break below $32 last week so I must follow rules and take the profits for the MSW Index and move on. The relative strength rating has dropped from:
89 on July 29, 2005 to
83 on November 30, 2005 to
75 on December 12, 2005 to
66 on January 4, 2006 to
48 on January 22, 2006 (today)

We had an excellent trend buying opportunity in October and touted this area on numerous occasions at the same time (URBN) was making a final push to new highs before breaking down. In my opinion, it is sometimes a better policy to cut a stock while it still shows a small profit rather than waiting for it to give you a small loss in the future. When things don’t look or feel right, sell. Remember, you can always get back in if the trend reverses.

In the case of Tower group, the stock opened up for a 20% gain on the Index, only to be cut at the knees for a 12.96% drop below the 50-d m.a. I started the coverage in late October at $18.53 but have an uncomfortable feeling with the recent drop. As mentioned, the stock maintained a 3% gain while on the Index but I feel safe taking the very small gain rather than a small loss if it continues to drop. Even though the stock doesn’t show a loss at this point, you must learn that taking a small profit before it materializes into a loss may be the best course of action. The next level of support is the 200-d m.a. (currently near $15.94). I am not waiting around to see if it holds my entry area or this lower level of support above $15. The current RS rating sits at 88 for (TWGP) but has dropped off from 96 earlier last week.

Piranha

Mid-day Market Report

Over the past month we have seen the NH-NL (new high – new low) ratio gather strength briefly, only to falter this week. The ratio ending on Saturday, January 14, 2005 gave us a weekly average of 500 new highs, the first time we topped this mark since last July. The month of October averaged 136 new highs per day, November averaged 240 new highs per day and December averaged 305 new highs per day (excluding the holiday shortened week). We saw the up-trend coming by watching this indicator and the price and volume of the major market indices. Following the leading stocks allowed us to place positions before the crowd started to realize a mini-bull run was underway.

Heading into today’s action, we are looking at a weekly new high average near 321 stocks per day. If Friday’s action stays in line with the current weekly average, we will drop to the lowest levels of 2006, stepping down more than 180 new highs per day from last week. I am not turning bearish because the ratio is far from turning negative, a situation we have not seen since the final week of October when the NH-NL ratio closed at 111-162. One of the worst weeks of last year came in mid October when the ratio ended at 46-317 on October 15, 2005 (a far cry from last week’s 500-32).

The market reversed the bear trend yesterday with a strong showing of leadership, giving us 471 new high with many of the MSW Index stocks making large gains. As a group, the 28 stocks moved up over 2%, regaining the entire 1.25% loss from the previous day. Yesterday is long gone though because today we are getting beat down with sharp losses across the board as GE and Citigroup break the DOW. As of 12:30pm Friday, twenty of the twenty eight MSW stocks are showing a loss with (AAPL) and (GMXR) leading the way (two of our best stocks over the past six months). I could care less about the leading DOW stocks as I focus intently on my personal holdings and the remainder of the MSW Index. When they are falling, I know the market is having a bad day or making a correction.

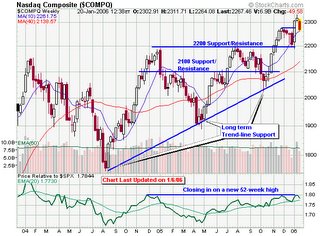
Looking at the NASDAQ chart below, you can see how the index is challenging the recent breakout level and the 50-d moving average. Looking at the price relative to the S&P 500, we can see that the NASDAQ has been struggling to break above the resistance line for the past three months. If the 50-d m.a. is sliced, I will be looking back down to the long term support at 2,200. Stay tuned to see how the markets close this afternoon and what the final NH-NL ratio will be later today.


Piranha

Away during the Trading Day

MSW Member Question – Part #2:

Hello Chris,

I am new to MSW and also to investing in general. I had a question regarding breakout volume. Intra day, how is it possible to determine that there is above average volume? Let’s say that early in the morning, the price is around 17.50 and the pivot/breakout point is 17.75, how is it possible to determine that there is above average volume for this particular stock so early in a trading day? I’m a bit confused. Also, I attend school for major parts of the trading day, is it even possible for someone like me to focus on breakouts if I can’t be at the computer monitoring the stock and volume?

By the way, I’d like to say thanks for all your great screens. I have learned so much in just a few days.

Talk to you soon

My Answer:

To answer your second question: anyone can trade without monitoring their stocks during trading hours. I don’t day trade and I don’t need to watch a computer during trading hours as I make 99% of all my decisions after the markets close so I am less likely to make a poor emotional decision during the intraday action. If you continue to read my screens and my analysis each night, you will realize that I make many of my trading decisions over the weekend when I can’t be influenced by live action. Believe this or not but I almost always make better decisions during the weekend after I can digest larger amounts of information versus a decision during a weekday or week night when emotions are flying high. Again, this is just my own style as it differs for each person.

For example if I see a stock creeping up on a breakout area over the weekend, I will make a decision in my head to buy immediately if it passes the pivot point on strong volume the following week. I have triggers set up to alert me when this happens during the week so I can react without hesitation because my mind is already made up. I have thought-out the scenarios in my head before the breakout happened so I don’t have to think twice to make the buy – it’s already a go.

In your case, you can set up automatic trades in your account while you are in class to buy certain stocks with specific parameters that you set the night before. If your trade triggers hit but you find out the trade didn’t go as planned, sell the following day – not a big deal. Remember, it is not a bad thing to sell – too many novice traders think it is bad to sell if they are wrong. The best thing you can do is sell immediately when you know something is wrong – it saves you money!

Piranha

Intraday Trading Volume Question

MSW Member Question – Part #1:

Hello Chris,

I am new to MSW and also to investing in general. I had a question regarding breakout volume. Intra day, how is it possible to determine that there is above average volume? Let’s say that early in the morning, the price is around 17.50 and the pivot/breakout point is 17.75, how is it possible to determine that there is above average volume for this particular stock so early in a trading day? I’m a bit confused. Also, I attend school for major parts of the trading day, is it even possible for someone like me to focus on breakouts if I can’t be at the computer monitoring the stock and volume?

By the way, I’d like to say thanks for all your great screens. I have learned so much in just a few days.

Talk to you soon

My Answer:
There are two ways to go about this:

  1. I use Investor’s Business Daily (investors.com) volume calculation tool to simulate end of the day trading based on the total volume at a certain point during that day’s time. The tool is not perfect but it saves me time from performing my own calculations.
  2. Another way is to project the end of the day’s volume based on the number of shares traded at a certain point in the day.

For example, If XYZ averages 2 million shares traded per day over the past 50-d days, we can assume that the volume will be 50% larger than the average if the stock is trading 1.2 million shares by noon.

The earlier in the day we see the breakout above the pivot point, the tougher the task becomes to estimate what the final volume total will be when trading closes. If the average is 2 million shares per day and the breakout occurs at 10am with only 200k shares traded, we will not know what the final tally will be. In this type of a situation, I buy the stock anyway to grab it as close as possible to the pivot and then make my judgment when the day ends. If the volume was weak or if the stock reversed during the later hours, sell the following morning. Most individual investors use discount brokers so a $10 or $20 trading fee should not stop you from making the correct moves. If $20 hurts your trading stake, you should not be trading at all.

Also keep in mind that most stocks will trade move heavily during the first and last hours of the trading day so this will most likely skew the numbers when trading begins. Another important volume statistic to watch is the total weekly volume count as most stocks have higher volume during the breakout week than the prior week. IBD has been quoted as saying over 90% of all breakout stocks have higher weekly volume during the breakout than the prior week of trading.

    Piranha