Let the Base Breakout before Buying

RightNow Technologies Inc. (RNOW) was removed from the MSW Index yesterday before it ever had a chance to make a move out of the cup with handle base it was forming. Earnings were up for Q4 but future expectations were lower than analysts expected, making this stock fall more than 20% in the first two days of trading this week. Any stock that falls 10% or more from the original coverage price is automatically removed to protect from further losses – no questions asked.

We have a rule on our Philosophy and Education page on our main site that states:

“We do not buy until the stock triggers the pivot point on above average volume also known as qualifying volume. This is the area where the stock faces the least amount of resistance as all overhead sellers are gone as we break into new high territory. The pivot point usually comes within 5% to 15% of the stock’s old high. Try not to buy a stock after it is 5% above the proper pivot point. This does not mean that we can’t buy on normal corrections and pullbacks as the stock remains in an uptrend. The rule only applies to the pivot point area as the stock becomes extended.”

RightNow (RNOW) didn’t breakout from the cup with handle base so you should have never bought the stock. Our analysis from week to week is listed below. To see a beautiful “successful” cup with handle breakout, study the chart located on our Technical Analysis page for Domino’s Pizza.

On our Technical Analysis page, we define a cup with handle pattern as follows:

“Look for relatively quiet volume as the stock builds the left side of the cup. Volume at the base of the cup should be slightly higher than the left side as support is coming into the stock. The right side of the base should have above average volume with more up-days than down days. The handle will be the last part of the formation and should slope slightly downward with lower volume than the right side of the base. Our pivot point will be slightly higher than the highest point of the right side of the base. All breakouts should occur on volume 100% greater than average daily volume.”

RightNow Technologies (RNOW) fell 14.99% yesterday (bringing the weekly drop to 20.30%). You should all know that any stock that violates a 10% loss (RNOW – 10% sell stop was set at $17.34) on the MSW Index is instantly removed from the index. Volume was up 1,095% versus the 50-d m.a. giving us the largest distribution day in the stock’s short life on Wall Street.

I will repeat a story that I posted on the daily screen last night from a member (for emphasis): The member e-mailed me about this stock (RNOW) since he had already established a position at an earlier date. He asked about the up-coming earnings release Monday and what he should do. I told him to follow his gut feeling or sell half of his position if he was worried and not sure (remember, the buy signal had not come since the pivot point was not reached on MSW).

He asked about short term capital gains taxes and I told him that the “gain” in the stock was more important. I am not sure what he did as he has not written since the earnings release. If he followed his gut, I would have to say he sold before the 15% drop today. I could tell in his words that he was worried. When you are worried about a position, get out (you can ALWAYS GET BACK IN).

RNOW history on MSW Index:

January 7, 2006
Coverage Initiated at $19.27 with support located at the 50-d m.a.
Comments: Has made past daily screens as the stock started to form the right side of a long 14 month base since the original IPO run-up. The buy zone is slightly below $21 and it dates back to late 2004. The target here is a run to $35 in the next 9 months.

January 21, 2006
Posted at $18.65
The handle continues to form with a breakout above $21. Support is located below at the 50-d m.a. ($18.13) Rating: Buy on strong move above $21

January 28, 2006
Support $18.13
Buy Zone: $21.00
A 7.24% gain this week as the stock is setup to breakout above the $21.00 buy point on the P&F chart. A triple top breakout will occur above $21. Volume should reach approximately 2 million shares on the breakout. Rating: Buy on strong move above $21

The stock never made the breakout so NO ONE should have bought the stock prematurely or you would be breaking rules. If you broke rules – you lost money in this trade. IT IS THAT SIMPLE!!! FOLLOW THE RULES!!!

Piranha

MSW Stock Index on Fire

The MSW Index was busy today as 14 of the 27 stocks were up by 2% or more. For the day, the Index was up 1.33% but that includes the 5.95% drop in (HANS), a stock that I placed my sell at $95 and placed the MSW Index sell at $89.89 (our typical $60-$100 profit safety). Excluding the loss in (HANS), the index gained 1.62% (in addition to last week’s 4.65% gain. The fourteen stocks that moved ahead by 2% or more gained an average of 3.71% with True Religion (TRLG) leading the pack with a 7.52% gain.

The MSW energy stocks raced ahead with (GMXR) leading the pack with a 6.75% gain.
(UPL) was up 3.36%
(HYDL) was up 2.74%, did so on volume 151% larger than the 50-d m.a.
(HAL) was up 2.45%
(LUFK) was up 2.07%

The big winner from last week, Netlogic Microsystems (NETL), added another 2.48% on volume 139% larger than the 50-d m.a.

Finally, Under Armour (UARM) broke out above our buy zone of $40 with a 5.06% gain on volume only 19% larger than the 50-d m.a.

I will continue this analysis after I perform the typical “end of the day” research for tonight’s daily screen.

See you then,
Chris “Piranha”

Additional Weekly Analysis

The New High – New Low (NH-NL) ratio finished at 826-33 on Friday, the largest single day total since July 11, 2005 when it closed at 826-17. We have been following the weekly NH-NL weekly averages since the week of July 16, 2005 and have not had a more successful week than the past five days. This week’s average of 516-46 slightly edges out the week of July 30, 2005 when the ratio closed at 511-28. This was only the fourth week in the past six months where the weekly average closed above 500 new highs.

Below is a list of the weekly averages since July 16, 2005:
Saturday, July, 16, 2005: 503-21
Saturday, July 23, 2005: 382-23
Saturday, July 30, 2005: 511-28
Saturday, August 6, 2005: 465-38
Saturday, August 13, 2005: 250-62
Saturday, August 20, 2005: 124-59
Saturday, August 27, 2005: 129-62
Saturday, September 3, 2005: 267-71
Saturday, September 10, 2005: 375-48
Saturday, September 17, 2005: 253-63
Saturday, September 24, 2005: 226-157
Saturday, October 1, 2005: 255-116
Saturday, October 8, 2005: 197-144
Saturday, October 15, 2005: 46-317
Saturday, October 22, 2005: 73-220
Saturday, October 28, 2005: 111-162
Saturday, November 5, 2005: 241-93
Saturday, November 12, 2005: 231-111
Saturday, November 19, 2005: 248-155
Saturday, December 02, 2005: 312-73
Saturday, December 10, 2005: 309-77
Saturday, December 16, 2005: 293-104
Saturday, January 7, 2006: 473-47
Saturday, January 14, 2006: 500-32
Saturday, January 21, 2006: 348-46
Saturday, January 28, 2006: 516-46

As you can see, we are starting to gain some strength in January with two of the past three weeks averaging 500 new highs or greater. January has been one of the strongest months over the past year and the leaders are starting to gain momentum. Backing up the strength of the ratio has been the performance of the MSW Index over the past several weeks. As mentioned yesterday on the weekly screen, the MSW Index gained 4.65% this week, topping all of the major market indices and the IBD 100. Netlogic (NETL) was the biggest mover with a 20.25% gain, bringing its total gain on MSW to 56% since it was posted on 11/11/05. As you know, I only added one new stock to the Index this week, bringing the total to 27 stocks but I am studying a few others.

Looking at the NASDAQ, which was up 2.5% for the week, we can see how the Index moved back above the 2,275 level (the short term support/resistance line). The index also crossed back above the 50-d moving average on the largest positive weekly volume in the past two years.

Both the DOW and the S&P 500 crossed back above their respective 50-d moving averages with the DOW recovering the 10,750 support/resistance line. The small cap S&P 600 hit a new all-time high with a 3.4% gain while the MidCap 400 also hit an all-time new high with a 2.2% weekly gain.

Continue to monitor the major indices (price and volume), the NH-NL ratio and the individual stock market leaders. Here are some of our MSW Index leaders over the past few months:
(GMXR) – 90%
(CTRN) – 70%
(HANS) – 62%
(NETL) – 56%
(CRDN) – 52%
(ESRX) – 51%
(NWRE) – 42%
(OXPS) – 33%

Piranha

ESRX in the Home Stretch

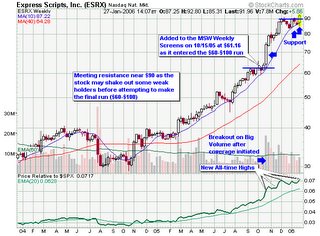
I started to cover Express Scripts (ESRX) in early October as it neared the $60-$100 range while forming a short term consolidation before attempting to make the big move. I officially added the stock to the MSW Index on 10/15/05 at $61.16 as it broke-out into this range. Below is what I said when I added the stock to our Index:

“Express Scripts, Inc. (ESRX) was added to the weekly screen as the stock will debut on the MSW watch list. It is above $60 and has a long history of strength so it is a prime candidate for the $60-$100 run. Some of you may think the stock is priced too high and has already run up too much for additional gains but I will counter by asking you to look at former MSW stocks that started coverage in the $60 range: HANS and BMHC. Also take a look at Tenaris (TS). The stock has been mentioned on a handful of daily screens and was named on our short list during last week’s final screen. The stock has entered the $60-$100 run and is currently sitting slightly above the 50-d m.a. which is a trend buying opportunity.” – 10/15/05

To date, (ESRX), (HANS) and (TS) all remain on the MSW Index with Tenaris (TS) making the biggest moves into new high territory in recent weeks.

I made these comments on the MSW Index about (ESRX) last Saturday:
“The stock failed to cross $90 two times this week. The resistance at this level continues to grow. A strong close above $90 is an instant buy. Rating: Buy with move above $90” – 1/21/06

Today, the stock is up over 3% and has finally broken above the resistance level at $90. With the move above $90, we are now in the final stretch of the $60-$100 run. The stock has gained a respectable 50% over the past three months on the MSW Index. I don’t know about you but I will always take a steady 50% gain in a $60 stock rather than roll the dice with a $5 stock that has no prior history of strength.

Now is the time to place the physical sell stop to protect the gains from the $60-$100 move. ESRX is just another example of a long line of stocks that easily trek from $60 to $90+ in a matter of months.

The image will enlarge to the proper size!

Piranha

Mini-Daily Screen

Due to the special screen exercise I initiated to all members last night, I didn’t have a chance to upload a more traditional daily screen. Below is a condensed version of the typical daily screen from yesterday.

Four of the top ten performing industries on Wednesday came from the Metals/Steel sector. Half of the stocks located in the metal distributors industry made gains that resulted in new 52-week highs. A quick glace at IBD would show you that this industry group is ranked fourth out of 197 total groups with a 20.3% gain in 2006 (by far one of the early leaders in the new year.

On the flip side, six of the worst performing industry groups were oil and gas related as crude oil closed down $1.21 to $65.85. As I mentioned over the weekend, crude oil prices have not been climbing due to supply worries; they have been climbing due to growing concerns in Iran and Nigeria. Of the five energy related stocks on the MSW Index, (GMXR) and (LUFK) fared the best. Geo Resources (GMXR) is now up over 83% since it was added to the MSW Index on September 27, 2005 (it is up over 180% since the first daily screens it started to make last July). Lufkin is up almost 20% since making the MSW Index in mid-December.

The NASDAQ and DOW both moved lower on higher volume but the losses were minimal so the distribution doesn’t weigh as heavily on the recent count. The count now stands at five distribution days for the S&P 500 and NASDAQ over the past month of action. The DOW is still within 40 points of the long term support and resistance line that dates back to early 2004. The NH-NL ratio finished at 453-52 (a solid sign of strength among the leaders).

Some Interesting Stocks from Wednesday:

  • LUFK – 63.60, bucking the trend as the stock brings its total gain to 19% on MSW
  • GMXR – 43.92, a total gain of 83% in four months
  • VIVO – 25.97, a big intraday reversal that has spilled over into a 5% loss today. Support sits at $23 with our Index entry at $24.16
  • NMHC – 30.40, building a 19-month base with new 52-week highs and an ascending triple top breakout on the P&F charts.
  • LCAV – 52.38, another new high for this former MSW stock from late 2004 and early 2005
  • NETL – 33.03, up yesterday and up another 5% today as the stock continues to rise without taking a breather. Keep those physical stops set and allow them to trail the growing profits. With today’s gain, the stock is up 47% since the initial coverage on 11/12/05 at $23.56 (not bad for two months).
  • CRDN – 54.55, topping $56 on Thursday, bringing the MSW Index gain to 48% since the initial coverage on 10/28/05
  • KNOT – 14.44, as you know, we cut the stock from the MSW Index when it fell below the 50-d m.a. but it has since reversed, gathered strength and moved to new highs. It will not be back on the Index but I thought it deserved some notice.

Piranha