NutriSystem Gaining Weight?

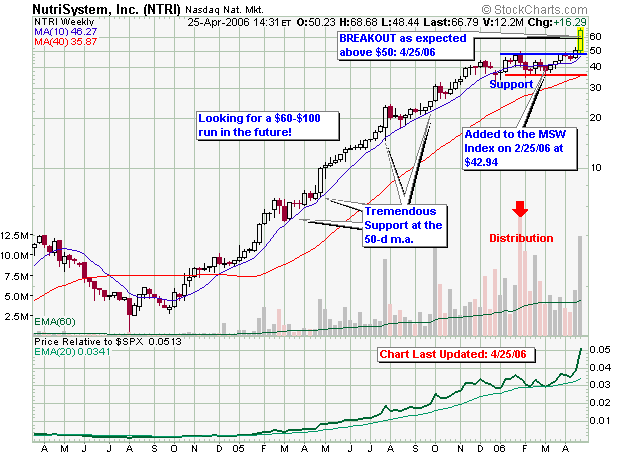
Weight among investors that is! NutriSystem Inc. (NTRI) is up more than 33% today after the company easily beat earnings from the same period last year. Numbers reported yesterday showed an increase in earnings from $0.10 to $0.60 while revenue increased from $34.7 million to $146.7 million. Was this a surprise to MSW? Not really, considering the close coverage of the stock over the past couple of months. I have been covering the stock on the MSW index since February 25, 2006 with a target breakout area of $50 and a breakdown area of $35 (a number that was never hit).

After today’s advance on huge volume (I wrote about the after hours trading in last night’s daily screen), the stock now shows a 57% gain in two months on the MSW Index, adding another success story in the early months of 2006.

Below: Read the weekly analysis carefully and you will see that I called this one perfectly as it led up to today’s breakout explosion. By the way, the options I spoke about on 3/11/06 were worth $9.60 per contract back then – they jumped to $32 per contract today (a 233% advance in six weeks). As recently as April 15, 2006, I wrote this: “The good news: if it breaks $50, the buy is even stronger this time around. The more times it tests resistance, the stronger the potential breakout becomes.”

Finally, visit the blog post I wrote right here on Market Talk back on February 22, 2006:
Consider Timing when Buying a Stock

4/22/06
NTRI – 50.50, We broke above the $50 resistance level but reversed from the high and closed at $50.50. The stock was up 11.43% for the week on the largest weekly volume since February. Rating: Hold

4/15/06
NTRI – 45.32, After reaching $49, the stock couldn’t penetrate or even challenge the resistance level. The good news: if it breaks $50, the buy is even stronger this time around. The more times it tests resistance, the stronger the potential breakout becomes. Rating: Hold

4/8/06
NTRI – 46.95, The small gain turned into a loss as Thursday and Friday sent the stock lower as it neared the resistance level and the top of our trading range. The next buy opportunity is a strong move above $50. Rating: Hold

4/1/06
NTRI – 47.52, NutriSystem crossed above the $44.80 area without a problem and is now looking to make a new high breakout. Volume is up with a 9.62% gain this week but I would like the stock to slow down before making the possible move above $50. Patience in this stock may pay off as I maintained coverage during the correction. Rating: Breakout buy above $50

3/25/06
NTRI 43.35, Back above the 50-d m.a. as the stock continues to make small gains quietly. Up 7% this week. It will be interesting to see if the stock can cross above $44.80 (the next peak number). Rating: Buy on new high (above $46 to $50)

3/18/06
NTRI – 41.04, Up 7% this week as the options are looking good. September 06 calls are the selection but I wish I had longer options because I would be in those. Still trading in range $44.80 is the next critical number to pass) Rating: Buy on new high (above $46 to $50)

3/11/06
NTRI – 38.14, I see something interesting here: Still trading in the range but the lows are becoming “higher lows”. Hit $32.37 in December, $35.01 in February and has only reached a low of $37.10 this month. If it doesn’t break lower than $35.01, the trend may resume higher. The P&F chart shows the higher lows formation. Rating: Buy on new high (above $46 to $50) – I’m looking at options here.

3/4/06
NTRI – 40.16, Gave back 6.47% of the 10% advance from the prior week but volume was lower (still above average). A breakdown is a move below $35. Rating: Buy on new high

2/25/06
NTRI – 42.94, Up over 10% as it recovered its moving average. I wrote a detailed blog on the stock earlier in the week and continue to remain on the bullish side. A buy happens with a new high above $50 on above average volume. At this time, it officially reenters the MSW Index. A breakdown is a move below $35. Rating: Buy on new high

Piranha

ADVS on the Move

Advent Software, Inc. (ADVS) is on the move today after an upgrade was issued earlier this morning. The stock is up over 6% in early morning trading on volume larger than the average. ADVS was added to the MSW Index three weeks ago at $28.42 as a 200-day moving average play (similar to STRL – up over 40% in two months as another 200-d m.a. play).

Below is the analysis over the past three weeks as the stock has been on the index.

4/15/06
ADVS – 28.18, up a penny this week as it continues to hold the 50-d and 200-d moving averages. The trend buy is now with anticipation of a short term move above $30 (towards $34). Hold (always sell on a breakdown below your sell stop – below the 200-d m.a.)

4/8/06
ADVS – 28.17, sitting on the 200-d m.a. on the weekly chart and slightly above the 50-d m.a. on the daily chart. A trend buyer could enter right now with anticipation of a move higher (similar to STRL). Rating Buy to Hold (always sell on a breakdown below your sell stop – below the 200-d m.a.)

4/1/06
ADVS – 28.42, I bought the stock myself. I don’t know if it will work out but I placed money on the idea and have rules to protect the downside. As you have been noticing, I have been making several 200-d m.a. momentum buys in recent months. A twelve month price target will be from $38-$40 (FYI: I got in lower than the Index price as I bought on Thursday).

It will be interesting to see where the stock goes from here as I am looking at a short term target of $34 and a longer term target above $38 towards $40.

Piranha

Tower Group (TWGP) Breaks Out

Tower Group Inc. (TWGP) was up over 14% on volume 225% larger than the 50-day moving average as the stock broke out of the cup with high handle base; above the pivot point of $24.56. I have been covering TWGP over the past month and have listed the analysis I provided for TWGP on the MSW Index each week since March 4, 2006. The close above $26 takes the stock half way to the projected target of $30 I gave one month ago at $20.

The MSW Index has been on fire and stock after stock continues to breakout of properly formed bases giving all of us ample opportunity to take profits out of the recent run of individual stock leaders. There is no reason why MSW members should not have caught at least one of the several breakouts this past week as I have been covering them all since their bases were forming and their potential pivot points became apparent. Below is a quick history on the stock over the past month on the MSW Index (weekly screens).

The chart in this blog post also shows you that we started to cover TWGP last October but targeted the stock a bit earlier than I wanted. The stock never violated the pivot point from October but I cut the coverage from the MSW Index. When the recent base became apparent, I immediately placed the stock back onto the MSW Index before it took off with the recent 30% gain in 4 weeks.

  • 4/1/06:
    TWGP – 23.10, the slight drop is welcomed as we may be forming the start to a possible handle formation. The new pivot point is now $24.56 with support lower at the moving averages. Rating: The new buy is above the pivot point – CANSLIM rules
    3/4/06: 20.95

  • 3/25/06:
    TWGP – 23.39, Up another 6.71% this week as the stock managed to make a new all-time high. A handle hasn’t formed but the stock is up over 10% on MSW in three weeks. Rating: I would like to see a handle and exact pivot point to form

  • 3/18/06:
    TWGP – 21.92, up over 7% this week as the right side of the base looks to complete its formation and start a handle pattern. If a handle starts to form, we can target an exact entry area. Rating: look for cup base to build right side properly with handle
  • 3/11/06:
    TWGP – 20.37, the stock was down less than 3% this week as it closed sitting on the 50-d m.a. (gaining support on Friday). We may see a deep 9 week cup shaped base forming which would change the ideal entry point. Rating: look for cup base to build right side properly
  • 3/4/06:
    TWGP – 20.95, A former MSW Index stock for nine weeks from October 2005 to January 2006. When the correction started, we removed the stock from the index but it is back on recent strength and support. It was up this week on the largest volume ever! The buy is now with a target of $30 in the next six months.

Piranha

The Breakout of Gehl Co. (GEHL)

This is a question I received about GEHL earlier today:

Chris,

After the big breakout today, GEHL is still within 5% of the pivot
point. Would you recommend taking a position or has the opportunity
passed?

Thanks,
MSW Member

My Answer:
In a bull market, I would say to jump in if interested. In this type of market, I hesitate in giving that recommendation due to the large number of reversals among breakouts. If the stock reverses, you would be forced to sell quicker than usual. The stock is about 2% higher than our targeted pivot point of $35.15; so you are not chasing it too much from the ideal breakout area.

According to the rules (CANSLIM rules), it is still a buy. Place half a position if interested and watch what happens. If it works out, you can always add shares at a later date on a healthy pullback to the moving average. If you buy and it reverses, sell! Don’t worry about being right or wrong, worry about your risk and following the rules. If you follow the rule of cutting losses and letting the profit ride, the trade will take care of itself. Trade the idea and allow the money to do the talking.

Hope this helps,
Chris

Updating MSW Stocks

A small void has been left on the blog over the past several days due to my focus on the daily and weekly screens for MSW. After the death of a family member, I felt I needed to perform detailed analysis of the best possible opportunities according to my research for the members of the community. Now that the week is over, I will start to answer member questions on the blog, post up new articles, case studies and interesting stock market topics.

With March coming to a close (the end of the first quarter), I want to reflect on some of the stocks that I have been covering each and every week, specifically the successful MSW Index members.

MSW Index Stocks making moves in 2006:
OXPS – up over 33% since 11/12/05
NTRI – up over 11% in one month
TWGP – up over 10% in one month
TS – up more than 63% YTD
STRL – up 20% in two months
NETL – up over 75% in less than five months
PMCS – up about 10% in one month
NWRE – up almost 50% in five months
CAMP – up over 20% in March
HANS – up over 20% in the past two weeks (200%+ in 10 months on MSW)
LMS – up over 17% in the past week (former MSW All-Star)
CBG – up 37% YTD (up over 120% since covered on MSW last May)

Now compare the stocks above to the Major Indexes:
NASDAQ – up 6.23% YTD
DOW – up 4.48% YTD

Thirteen of the current twenty two members on the MSW Index have been added after February 1, 2006 with eight of those stocks added after March 1, 2006 and two of those stocks added after April 1, 2006. The Index is fresh with new faces and I look to add a new class of stocks to the MSW All-Star list by the end of 2006. Results are not guaranteed but no one can dispute the consistency I have had over the years covering many of the largest winners in the market.

The image in this blog contains the top 15 All-Star stocks that I have covered on MSW since 2004. A covered stock is one that appears each and every week on the MSW Index during its time on MSW, not a stock that appears once in 2005 and then once again in 2006. Besides, all of my 2004 and 2005 archives are being transferred into basic HTML pages for everyone to review. You can see how my research has expanded, evolved and formatted into what it is today. Anyone can now follow the coverage of a specific stock from week to week in the MSW archives. When we are done formatting the pages into HTML, I will generate a link on the blog that takes you to a quick pick page!

Piranha