MSW Index Top 20 Stocks from 2005

I have started to compile the complete results of the MSW Index and the MSW weekly screens throughout 2005 and have developed the top 20 list for your viewing on the blog. Click the picture at the bottom of this page to view the chart of the top 20 stocks from 2005. You will notice that 8 of the top 20 stocks are still active on the current MSW Index and several of the stocks with coverage initiated during 2005, ended their runs in recent weeks.

In the coming days, I will be uploading an exclusive page to MarketStockWatch.com that highlights the top stocks throughout the year, the worst stocks picks throughout the year, the ratio of winners to losers on the Index, our top shorting opportunities last spring and other important information about the stocks we covered in 2005. The next lists to appear on this blog will be the top shorts of 2005 and MSW’s biggest busts in 2005.

– As you all know, every trader has many busts throughout the year but the greatest traders learn to sell these stocks before they do further damage. As for the MSW Index; any stock that drops 10% from the initial coverage point is automatically cut!

Enjoy,
Chris Perruna “Piranha”

p.s. – Notice how many of the top stocks were covered week in and week out for 20 or 30 weeks (many consecutively) as they made their huge advances to profitability. (make sure the image opens to full size to read it properly)

Interesting Stocks with 15% of a New High

Today’s mini-screen was developed due to the two day exercise I performed on the typical daily screens on the main site. Instead of screening for stocks making new highs, I have decided to focus on stocks that are within 15% of a new high that possess strong fundamental and technical characteristics. I will review some of these stocks for the upcoming MSW Index this Saturday but we will not know if any of them are strong enough to make that list until tomorrow. Many of the stocks listed below are building bases are have started to form new trends that are suggesting higher prices in the coming weeks and/or months. Remember, the strongest stocks will land a spot on the MSW Index so don’t buy blindly because I post up a “mid week special screen” or a “mini-screen” on the blog. You still need to do your homework and determine if a specific stock will fit nicely into your portfolio and style of trading. I have eliminated all MSW Index stocks from the list below since I will cover them in depth tomorrow.

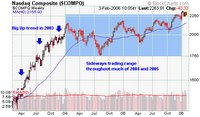
The DOW and the NASDAQ are flirting with their respective 50-d moving averages as they are still trading sideways when viewing a multi-year chart. The NASDAQ has been slowly creeping higher within the sideways pattern but has not launched a significant up-trend since 2003. We know the individual stock market leaders took a breather yesterday and the MSW Index stocks dropped more than the major indices but many of them did so on below average volume (a good sign). Friday will be important as some of our stocks will test support levels and/or moving averages. Today’s trading results may eliminate a few stocks from the Index, opening up positions for new candidates.

Interesting Stocks within 15% of a New High:

  • CEPH – 76.00, extended on the weekly chart but about to challenge the $77 high set on the point and figure chart
  • BBBB – 29.66, strong support this week with an 11.92% gap-up gain to recover the 50-d m.a. The support at the 200-d m.a. was very encouraging.
  • CLX – 63.08, forming a 10 month cup shaped base on the weekly chart that should form a handle before you look to take establish a position. If it breaks out, the stock will also qualify for the $60-$100 run
  • ANF – 69.27, forming an irregular cup shaped base that is currently forming the right side with higher lows on the P&F chart (support at the moving averages)
  • GRMN – 64.42, flirting with the 50-d m.a. as the stock sits in the $60 range but is not a an official $60-$100 candidate until it can breakout above the recent peaks set at $70.07 and $68.88
  • LRW – 25.54, set up for a triple top breakout with a move above $27. Solid support from the 200-d m.a. this week with a strong 8.27% advance on Thursday
  • CENT – 51.29, forming a six month cup shaped base with an obvious pivot reversal at the bottom of the cup in November
  • CNTF – 16.90, an interesting IPO from last fall that is starting to move higher with support from the 50-d m.a. On the weekly chart, a 10 week base has formed.
  • CERN – 48.35, an eleven week flat base has formed (it can also be considered a consolidation period after the larger up-trend in 2005. A triple top breakout will occur above $50
  • COGO – 9.11, a risky low priced stock that can make a double top breakout on the P&F chart with a move above $9.50 (risky play with an ideal entry closer to the 50-d moving average)
  • MCO – 63.95, when the stock reached the $40’s, it traded sideways for 7 months. It may do the same in the $60’s so if you make am options play for the $60-$100 run – give it time (at least 9 to 12 months).
  • PMCS – 9.76, not a typical stock selection for any MSW screen due to the larger overhead resistance that dates back many years but it did break the recent down-trend and has recovered the 200-d m.a. In my opinion, the risk is present but the chart suggests the stock is going higher.

Piranha

MSW Mid-Week Screen

…I am posting a mid-week screen to everyone today, a typical breakdown of the best performing stocks on MSW and detailed market analysis. This specific list also narrows down several stocks that made solid moves in the market Wednesday and are at or near new 52-week highs with strong fundamental and technical characteristics.

MSW Mid-Week Screen:
The MSW weekly screened stocks are starting to heat up! Today, the group of 24 stocks was up 3.56% collectively with only two securities giving us a loss (CPTV and WC, down -0.18% and -0.33% respectively). Our top gainer of the day was CUTR which has been itching to make the official screens for the past several weeks. As you already know, this stock has been on the weekly screens since August 20, 2005 when it was listed at $22.41 (with today’s close, the stock has gained 45% while sitting on the watch list). With a 20.85% gain on volume 978% larger than the 50-d m.a., I can say that the stock has made it presence. It posted earnings of $0.27 a share versus $0.07 a share last year. Analysts expected a jump to $0.14 while the company expected a move to $0.13 a share, both well below the actual report.

CB Richard Ellis was up an impressive 13.55% on volume 444% larger than the 50-d m.a. after crushing its earnings estimates. Third quarter earnings surged to $0.75 per share, well ahead of analysts estimates near $0.60 per share. Last year, the company reported earnings of $0.16 per share or profits of $11.9 million (yesterday the profits came in at $56.9 million). The resistance level that we have been establishing for this stock and the buy area that we have spoken about near $50 was crossed over today in a hurry as the stock made me proud after keeping it on the screens though the tough times. I rated CBG a buy for trend traders and momentum buyers over the past two weeks.

PATIENCE is essential; I have been writing about patience for months and days like today make me look like I know what I am preaching. This year (2005) has been tough for stock investors and it has been especially tough for equity research communities such as MSW because people start to lose faith in me instead of understanding what is taking place (they expect 100% gains every year and don’t like to see 20%-30% gains). Officially we are in a rally both on MSW and in IBD so stocks can be purchased but I would do it with caution until the NH-NL ratio returns to prominence. Eleven stocks from our most important screen (weekly screen which will become the MSW Index in the near future) were up at least 3.5% with eight of them doing so on above average volume. I will repeat that the MSW weekly screened stocks will always outperform the market on good days because I narrow down this list to the best performers with the most strength. Are the weekly screens repetitive? Yes they are from time to time but the stocks pay off in the long run and you will understand why jumping ship from stock to stock is a losing proposition. With strong stock selecting skills and the patience to wait until the “market trend” is right, you will make some of the best returns of your life.

Why am I so excited today? Because my leading stocks are giving me signals that the market may be ready to move. I am now in the mode to grab shares in stocks I have been following over the past two dismal months. I will be cautious because the NH-NL ratio must confirm the action but I also don’t want to let too many stocks get too far extended. If the NH-NL ratio does not confirm, be prepared for a nasty pullback so don’t get over anxious. I know the MSW All-Star list has been stagnant lately and many new subscribers expect to see the triple digit winners from the start but this is not realistic. If this new rally lasts and turns into something stronger, you will see fresh names make that list but until the market creates a new bull, most of the gains will be under 100% but far better than the market and most competition.

With the NASDAQ back above the 50-d m.a. and the strong surge today, we can feel safer adding new positions to our portfolios. Do not use margin until that NH ratio starts producing at least 800+ new highs per day. As this rally continues to develop, you can slowly move away from the cash reserves that I had you move into over the past couple of months. Last month in the mid-week screen, I said that a critical point for crude oil was $60 per barrel and if the number was penetrated, the market may turn higher and the energy sector may be in trouble. Crude oil ended at $59.75 today, the lowest close since July. With earnings beating expectations across all sectors, the market is finally moving higher when it should (after positive announcements). The NH-NL ratio ended at 298-91 today, the strongest new high total for the week. Since many stocks have been beaten down over the past two months, this indicator will take a few more days and or weeks to reach the required rally territory. If the indicator fails to produce 500+ new highs per day over the coming weeks, I will get worried. Until then, I will use the MSW weekly screened stocks as my gauge for the strength in the market and will confirm what it is saying as December approaches.

This week, we have been watching as several sectors are moving to the front of the pack and they include medical stocks, transport stocks, computer software stocks and other technology related industries. Specifically speaking, transportation and insurance industries have been making a lot of noise this week with investment banks also moving higher.

Tonight, I will cover several big performers from the MSW weekly screens and I will also post up some strong performers outside of the MSW stocks on a blog post that will be uploaded tomorrow morning. Enjoy the gains today and get ready to rock and pull the trigger if this rally last, don’t get gun shy, you can always sell at a small loss or for a small profit if things turn bad. Don’t kick yourself in the side six months from now because you missed the beginning stages of an attempted rally. Play the odds, use risk control and you won’t need to worry no matter what the markets throws at us. If the market develops a strong rally, your reward will be a big fat portfolio gain, one that you earned based on sound rules and judgment and you will be happy to pay the capital gains in a year or so. I am always happy to pay capital gains because I know I had a great year!

MSW Movers Today:
CUTR – 32.52, up 20.85% on volume 978% larger than the 50-d m.a. The stock crushed earnings today and is now extremely extended from any major buying opportunities.

CBG – 56.32, up 13.55% on volume 444% larger than the 50-d m.a. The stock was up near $55 within the first hour of trading, almost 10% past the official entry area. CBG now has a 51% gain on MSW since May.

THE – 48.42, the recent case study was posted yesterday and the stock added another 4.78% to the recent gains. Volume was up 48% versus the 50-d m.a. The stock has gained 36% since being listed on the screens at the end of September.

AAPL – 59.95, I hope everyone held earlier in the month when I specifically came out and told you that I was a holder until it broke key support lines (moving averages). Since the drop to $47.87, the stock has rebounded for a 25% gain. Since it was re-listed to the MSW screens in July at $41.55, the stock is up 44%, one of our top performers during the dreadful summer months. Since the first MSW weekly screen last October, the stock is up 153%. The reason it is not an All-Star is due to the fact that we sold the stock earlier this year when it started to breakdown and correct. If I held the entire time, it would be on the All-Star list. I try to be honest with the rules of the site.

ESRX – 78.15, up 4.13% on volume 97% larger than the 50-d m.a. This stock was added as a $60-$100 candidate on October 15, 2005 at $61.16. In a couple of weeks, the stock has gained 28% on MSW.

ADSK – 47.60, up exactly 4%, this stock rounded out our biggest winners today that made gains of at least 4%. The stock is up almost 30% since June when it started to consistently make the weekly screens.

NNDS – 38.80, the stock passed the original pivot point that was reached two weeks ago before the reversal but needs one more big day to make that new high and be a sure breakout. A move above $39.79 would qualify.

WFMI – 149.87, this horse has been a champ since getting support near the 50-d m.a. We now have a 28% in the stock since the first screen in May at $116 per share. Some thought the stock was too high once it crossed over $100. What are they saying now? Buy with the trend and you will be okay, never think a stock is too high to purchase or too low to sell.

Other Stocks Making Noise Today:

Medical:
WOOF, HOLX, STJ, SMTS, HITK, ISRG

Business Services:
EXBD, SAY

Computer Software:
BLKB, KNXA, BBBB, CRM, TALX, CNQR

Internet:
TRAD, GYI

Others:
HANS, MIDD, NWRE, ELOS, MNT, EXBD, BOOM

Several stocks listed above have made past MSW weekly screens but were removed due to corrections or for profit taking. These stocks include HANS, HITK, CRM, ELOS, BOOM & WOOF. The most recent stock from this group that was removed was CRM as it corrected with the market over the past two months. Recent action has kicked it back into gear as the stock is trending higher. Hansen (HANS) broke out to a new 52-week high and looks to be ready to make a $60-$100 run for the second time (it made the run earlier in the year before the split). We followed the stock from the $60 level until it hit $100 here on MSW. If options were available, I would be buying “at the money” calls with at least a 9-12 month time frame.

Updating Tuesday’s Action

…On Tuesday, Building Materials (BMHC) (a member of the past 11 weekly screens; first screen on June 1, 2005 at $64.10) was up $4.27 on volume 48% larger than the 50-d m.a. This was the first major push since the stock broke back above the 50-d m.a. Below, you can see what we have said about the stock over the past three weeks. We came very close to removing the stock from the screens but decided against that idea on August 13, 2005 because the stock did not violate any initial buy areas. I am glad that I maintained my PATIENCE (something I always preach on MSW) because the stock is currently trading at $92.12 (Wednesday afternoon) after reports that 2Q profits almost tripled. The stock is up another 12% today as we approach the afternoon trading hours.

Here at MSW, we let the big winners run and always cut losers and today we proved that we were on the mark once again. BMHC never became a loser so we did not cut the stock even though it did violate the 50-d moving average. The stock is up over 20% since I said a “trend buy” was valid this past weekend and the total MSW gain is now above 43% in this poor summer market. The $60-$100 run is nearing completion and I am very proud with my stability and decisions on this stock.

8/28/05
BMHC – 75.12, This is the area to place a trend buy with a tight stop, especially due to the weak market.

8/20/05
BMHC – 72.61, Slightly below the 50-d m.a. but holding above our original buy point. A major red flag would be a breakdown below $68 (a triple bottom breakdown on the P&F chart).

8/13/05
BMHC – 71.72, The stock was down 1.89% on the largest volume of the past few years yet the stock ended the week $3 higher than the lowest point. With the huge volume and the recovery towards the end of the week, BMHC bought itself one more week on the weekly screens.

The lesson: always have patience with your positions that are not showing a loss, especially during tough times in the market. They will reward you well if you learn to let them run (patience is key as Jesse Livermore always said).

As for yesterday, we saw the energy stocks lead the market to a gain after the devastation of Hurricane Katrina became more apparent. Stocks such as Fording Canadian Coal Trust (FDG), Valero (VLO), Peabody Energy (BTU), XTO Energy (XTO) and others lead the sector higher after damage reports were less than expected on rigs in the Gulf. More familiar MSW stocks such as Advent Software (ADVS), CB Richard Ellis (CBG), Sterling Construction (STV), Building Materials (BMHC), Tenaris (TS) and Apple Computer (AAPL) led the market higher. Other stocks that we are not covering that continued to move higher included Kendle International (KNDL), McDermott Intl (MDR) and William Lyon Homes (WLS).

Hansen Natural, a long time member of our weekly screens from earlier in the year is starting to make a move back above its 50-d m.a. but it is doing so on below average volume. Before the split, HANS completed a $60-$100 run in three months before retracing and forming a new base (where we removed the stock from the weekly screen and cashed in our profits). It will interesting to watch HANS as it continues to form the six week base pattern that dipped below the 50-d m.a. briefly. (Side Note: HANS is up another 4.41% on Wednesday bringing it just below the pre split adjusted $100 level ($50).

The NASDAQ is still below its 50-d m.a. but may be forming the bottom of a base that is just starting to take shape on the weekly charts. A quick glance at the daily chart and everything looks great but the timeline is still too short for a valid basing pattern. Relative strength is trying to regain the previous high set back in July but is still a way off of 52-week high levels set last November (2004).

I don’t like speaking about the DOW these days because it is below both the 50-d and 200-d moving averages with a relative strength line that is making multi-year lows (going back to the bubble burst years of 2001 and 2002). The point and figure charts shows us that the index is in a confirmed double bottom breakdown that triggered on August 23 as the DOW sliced below 10,500.

Piranha