Ten Stocks under $10

I’ve had several requests to do a special screen that locates interesting stocks under $10. As you know, I am not a big fan of stocks trading below $10 but I will perform a screen with this criteria about three or four times per year (to feed the craving).

Humans and their psychological minds love to dream about picking that one big winner from a low place and then ride it to riches. It does happen but not very often so don’t build your trading system from this type of thinking.

The last big winner on MSW from the sub $10 area was Forward Industries (FORD) in 2005 but this stock has since turned into a short in 2006. FORD etched the classic chart pattern that Stan Weinstein talked about in his excellent book Secrets For Profiting in Bull and Bear Markets (stage 1, stage 2, stage 3 and stage 4 bases). Actually, I think I will save this chart and add it to my technical analysis page on MSW as the “textbook” example of a four stage Stan Weinstein pattern.

Now, let’s have some fun and screen some stocks below $10 that present potential opportunities for those of you that can stomach buying these candidates. The stocks below do have decent relative strength ratings and earnings per share ratings.

Interesting Stocks under $10 – A screen for Fun:
*All prices from the close on 8/17/06

  • NXG – 3.86, catching support near the 50-d m.a. as it trades in a range between $3 and $4 over the past 14 weeks.
  • SLW – 9.45, the young stock is catching support at its new 200-d m.a. as it starts to build momentum to test all-time highs above $12. A move above $12 shows strength.
  • JSDA – 7.80, risky as it tests its 200-d m.a. The sister stock of HANS may have downward pressure if Hansen Natural continues to stumble below its 200-d m.a. Stocks move in packs so be wary if HANS breaks down further
  • Q – 8.59, nice strength with confirming volume over the past couple of weeks as the stock continues to tread higher. It has a long history of higher prices so it could be a longer term winner.
  • STKL – 8.53, the stock advanced more than 100% earlier in the year and is now correcting but the interesting thing I notice on the chart is the decrease in volume while consolidating the former gains. Support at the 200-d m.a. may provide a nice opportunity but wait for the move (don’t enter early)
  • GNA – 9.58, a trading range has developed between $8 and $11 but the most recent high in July could not surpass the prior high from April which is typically negative. A move above $11 would grab my attention.
  • NSSC – 9.65, seems to be catching support at the 200-d m.a. with a trading range between $8 and $12. It must move above $12 to prove the potential advance.
  • DTLK – 9.13, the stock is EXTENDED at current prices but it can become a buy opportunity if it falls back towards the 200-d m.a. and catches support. I wouldn’t consider a position until it at least pulls back to the 50-d m.a. just above $7 and fills the gap from last month.
  • GIGM – 8.58, building a 14-week base with support near $7 and resistance at $11. A double top breakout will confirm on the point and figure chart above $10.50 and a new high above $11.
  • CUP – 4.22, low priced risky stock that is looking to catch some support near $4 and the area above the 200-d m.a. With stocks gaining strength, commodity related stocks are declining but if Gold regained its footing, Peru Copper could continue the advance from its 2005 IPO. The original pivot point breakout in May was above $4.05 so look for the stock to hold this area.

I wanted to screen one last stock for pure fun: MSW
MSW – 10.79, Mission West Properties is above $10 but only slightly. I don’t know much about this company but it is gaining some strength near the 200-d m.a. as it consolidated from the prior run earlier in the year. The stock has not trended much over the past several years but I thought it would be fun to check the chart.

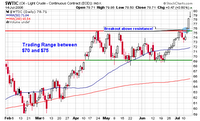
I have also included a chart of the NASDAQ which shows the breather that I indicated in yesterday’s blog entry. The index is pulling back today (expiration day) while some investors ell at this first Fibonacci retracement level. I also included a chart of the crude oil contracts as they are crashing down through the 50-d moving average. Major support is still owner near $69-$70. It will be interesting to see crude challenge this area; territory it hasn’t seen in two months.

Piranha

Interesting Stocks to Watch

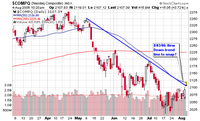
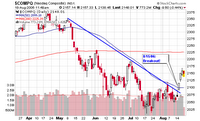
The NASDAQ is trading near the 50-day moving average today and has actually pushed above the down-trend line placed on my chart. If the index can follow through and close above both the moving average and the trend line, I consider this a successful week. I voted neutral on the latest Ticker Sense Blogger Sentiment Poll after voting negative the past couple of weeks (I hate to be on the fence but I am). If the NASDAQ can trade above these areas and the NH-NL ratio can continue to stay positive, I will start to get more of a positive feel for the overall health of the market.

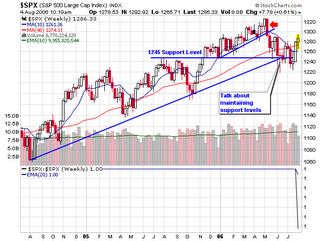
The S&P 500 is forming a cup shaped pattern and has overtaken the 50-d and 200-d moving averages and has moved higher in above average volume the past three weeks. Earlier this week, we had our strongest daily NH-NL ratio in months which tells me that some institutional buying is taking place as the summer heads down the home stretch. In any event, don’t rush to buy stocks on the long side until we get a market breakout and a strong weekly confirmation with the NH-NL ratio. Another important aspect to the market possibly gaining strength will be the health among the individual market leaders. Until they can gain their footing and move higher with volume support, we can continue to be skeptics (protecting our capital).

Below are a few stocks that interest me at this time along with a couple of lists highlighting the action from Thursday’s market (similar to a typical daily screen I run each night).

Some Interesting Stocks to Watch:

  • CELG – 46.95, a move above $50 is a buy signal on the P&F chart as the stock has a strong long term trend above the 200-d m.a. (since February 2005)
  • GILD – 62.07, buying above the moving averages as the stocks qualifies for a possible $60-$100 run
  • BOT – 127.06, a stock I profiled earlier in the year on this blog that actually corrected but is now challenging all-time highs. I am slightly skeptical of the long term move but the trend has been higher for the past couple of months (especially since it recovered the 50-d m.a. near $105 in June
  • EZPW – 38.82, could this be the handle formation to the 15-week cup shaped pattern? A move to new highs is very positive especially if volume increased above average
  • CMI – 119.28, up and down as buyers and seller struggle to take control of the direction of this stock. Buyers have a slight advantage at this point in time
  • TWGP – 29.37, trading in a consolidation range between $26 and $32. A buy happens above $32 with a triple top breakout on the P&F chart
  • AB – 66.04, the MSW Index stock continues to make the 200-d m.a. play successful as it also qualifies for a possible $60-$100 run

A Few Interesting Stocks making New Highs Thursday (8/3/06):

  • OMX – 44.42, first double top breakout yesterday above $44, another will qualify above $45 as a spread point and figure breakout
  • GES – 48.41, a 14% breakout above $47 this week with Thursday’s gain coming on volume 282% larger than the 50-d m.a. (50-day moving average)
  • CTSH – 70.31, a solid 10% move this week to breakout above $70 on above average volume (RSI line at all-time high)
  • EME – 54.26, the 200-d moving average play has now gained 22% over the past two weeks. Do not chase at this point but keep an eye open for a future consolidation

A Few Interesting Stocks within 15% of a New High (Thursday’s Market – 8/3/06):

  • ANSS – 50.39, a strong rebound with support at the 200-d m.a. Volume was up over 219% yesterday, signifying institutional buying power
  • NEU – 53.97, an MSW Index stock forming a nice basing pattern with a possible $60-$100 run in the future.
  • GIL – 47.32, another 200-d m.a. play with solid support from institutions as volume was up more than 280% on Thursday
  • PSA – 83.40, a 21-week cup shaped pattern with heavier buying over the past week or so. I prefer to see a handle form before takeoff so be careful with any entries in this area.
  • PVA – 71.28, the daily chart is somewhat sloppy but the weekly chart shows support at the 200-d m.a., a support line it has held over the past couple of years
  • TRMB – 49.05, reaching a new 52-week high in the early morning hours of trading on Friday (slightly extended from the major moving averages but it is gaining momentum)
  • PZZA – 33.95, I don’t like their pizza but the stock is gaining support at the 200-d m.a. in the midst of an eight month consolidation. Breakout to new highs is an entry signal (above $36 on the P&F chart)

Piranha

Ten Stocks to Watch

The NH-NL ratio finished at 97-182 on Thursday, staying on the negative side, reminding us that a rally is not taking place. Sellers continue to have their way with a 3-to-1 advantage during Thursday’s session as the NASDAQ gave back 2% (all of Wednesday’s gain) but volume was lighter. Staying on the topic of “large caps”, I noticed that Apple gained 12% after reporting bullish sales, Google fared better than Yahoo but is only up 0.49% heading into the final hour of trading on Friday (under both the 50-d m.a. and 200-d m.a.).

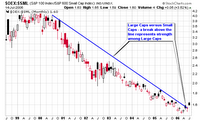
The S&P 100 Index/S&P 600 Small Cap Index that I track is up over 6% this week for its largest gain in years, confirming that large caps are moving to the head of the class. Investor’s Business Daily pointed out how CBOT (a stock I have highlighted on this blog in the past) blew past expectations but couldn’t gain much ground throughout the day after reaching a high of $126. The stock is actually down 3% today, telling us that buyers don’t have a chance, at least not now. The stock has formed a V-shaped cup with handle with a pivot point of $124.58 (breakout volume should reach 600k shares).

If the NASDAQ closes where it is right now, it will have its lowest close of the year (the lowest since May 2005). The S&P 500 index challenged its former support (now resistance) of 1,245 earlier in the week but looks set to close below this level within the next hour. Crude has dropped the past four days and attempted to climb back above $75 earlier in the day but looks like it too will close below former support (now acting as resistance).

So, are there any stocks out there to consider for a watch list?

Here are 10 to Take a Look at:

  • ADS – the stock has been falling for three straight weeks but I told MS members that this could be the case since it had to fill the gap from April, something it may be doing (down to $47.50). If it bases here (or gets support), I am buying several calls to speculate on my idea of a bounce.
  • GRMN – down over 2% for the week but the stock continues to hold the 50-d m.a. as support while maintaining a presence near the psychological triple digit threshold. I still like the stock in a rallying market (could make a nice option play for a solid run).
  • LVS – the stock is trading between a range of $65 and $74 (with some higher ticks) but it still sports a solid relative strength rating and solid fundamentals. The $60-$100 run is still a strong possibility
  • ZUMZ – trading in a range of $30 and $37.50 for the past 12 weeks with some minor intra-week movements above and below the major range. The most recent breakout of $36 was reversed but who can blame the stock in this type of market.

  • EZPW – filled the gap back down to $38 and is now trading between this level and the high above $45. I would consider this a handle to a longer pattern that could give us a nice run if the market were to breakout.
  • ARP – trading in a range between $32 and $39 for the past 18 weeks, all above the 200-d m.a. The stock has a supporting relative strength rating that suggests it can move higher in the next rally.
  • MAA – an 18 week base that has held up for the most part during the past two months as its relative strength rating continue to soar. A breakout to new highs is a buy point on the point and figure chart ($58).
  • ORB – the stock has been acting very well this week amid the negative tone among the other leaders and the major indexes. It managed to gain more than 5% during a weak of turmoil and it did so on heavier volume (above average). With the strong moves above $16, the stock is now slightly extended but one to continue to watch.
  • MED – the speculative stock that made us money earlier in the year is now forming a sideways consolidation base, one that has lasted for seven weeks. The support seems to step in near $16 with the weekly breakout above $20. Of all the stocks listed, this may become the best play for pure traders.

  • CSH – the stock has formed an 11-week cup shaped base without a handle. It attempted to breakout over the past two weeks but has not succeeded due to the weak market but this could be beneficial as it might form a proper handle. With today’s intraday low, the stock has basically filled the two gaps from earlier in the month.

Piranha

MSW Market Overview

This post contains a portion of the general analysis from the MarketStockWatch.com Weekly Screen: 7/10/2006 to 7/14/2006

Said on last week’s Weekly Screen Analysis (7/8/06):
“I still have doubt in my mind about this rally because it didn’t confirm within seven days.”

I want to start by stressing the importance of paying attention to the overall market (a statement I made to start last week’s analysis). If the market starts to pullback, so will the majority of stocks (another repeat statement). It will be very important to watch the leading stocks to see how they react to any corrections and/or pullbacks (a third statement from last week – this statement told us to sell test positions turning against us as noted on the daily screen on Wednesday and Thursday). So what do we do and how can we gauge what’s going on in the market?

I am looking for stocks that are holding up better than the major indexes. Stocks that fall less than the overall averages is a good place to start. My first list to check is the MSW Index, then the MSW watch list and finally I will search the daily screens and overall market for stocks that look like leaders based on their recent relative strength (when I say recent, I mean the past 5-8 trading days).

To start; how much did the major indexes fall?
NASDAQ: -4.4%
DOW: -3.2%
NYSE: -2.5
S&P 500: -2.3

Looking at the MSW Index, we see that every stock fell for the week, so which ones dropped the least?

GRMN: -1.75%
TS: -2.71%

These were the only qualifying stocks from the MSW Index that fell less than the major indexes. Garmin (GRMN) fell less than every major market index and found support near $95 and the 50-day moving average. It did qualify for distribution, the first in 13 full weeks. TS was strong but the stock has formed a trend line that is pointing down (I will add this trend line to the weekly chart; it can be seen best on the daily chart).

Looking at the MSW Watch list from last week, we see one solid stock:
KNOT: -1.29% (down less than the major averages)

With this in mind, we see that only two stocks maintained their leadership status based on this analysis but several of them are still above key support levels and will remain on the MSW Index because they are still better than most of the options out there. Only two stocks on the MSW Index contain RS ratings less than 90 (CME and ADVS with 89 and 88 respectively). Only one stock from the watch list last week currently holds a RS rating less than 90 (BLKB with an 86 – no longer listed).

Last week I said this: “Although the ratio turned positive, we ended on a sour note with the only negative daily reading of the week on Friday. We had our fewest new highs of the week and our most new lows for one day of action. Sprinkle in the fact that both the DOW and the NASDAQ fell 1.2% on slightly higher volume and we can start to become concerned if we have open positions.”

The foreshadowing was written on the wall with new lows expanding as the week wore on. We logged another negative NH-NL ratio with the weakest rating since the week ending June 17, 2006. We also witnessed the second most new lows logged in one week for the entire year of 2006 with only June 17 higher with 310 (the only week above 300 since October 15, 2005). With the market breaking down and the NH-NL ratio confirming, we are in some serious trouble. I have closed my test buys and moved back to cash (except for several long term option positions) and I advise that you all take serious looks at any stocks you may currently own. The sharp reversal in the market was not a surprise and I was not hurt much at all since I was only placing positions about 1/3rd my typical position size. This is the exact reason why I place test buys; all indicators weren’t in sync (specifically the NH-NL ratio).

Follow our three most important Indicators:
1. The price and volume of the major indexes
2. The action on the NH-NL ratio
3. The action among leading individual stocks

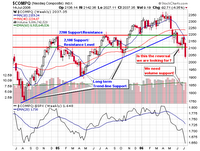
As we already know, all three indicators are extremely weak and all three indicators are heading down! The NASDAQ is at a nine month low and has violated all recent support; starting with 2,200, then 2,100 and then 2,050. The relative strength rating is at multi-year lows and is pointing straight down (a very steep drop over the past two months). The next low would be near 1,900 which was set back in April 2005. Looking at the retracement levels, we see that the NASDAQ has violated the 61.8% level of 2,178, the 50% level of 2,125 and the 38.2% which sits at 2,071.9. Based on all the information at hand, I would expect some type of bounce on Monday but that’s not a given especially since the Trader’s Almanac states that most Mondays are down after a negative Friday. We are definitely in a correction because the NASDAQ is down 14.2% since its 52-week high and 7.6% since January 1, 2006.

The DOW and S&P 500 have also violated all support levels but are in much better shape than the NASDAQ. The S&P 500 is only down 1% for the year and 6.8% since its 52-week high. I tend to rely on the NASDAQ more so than the DOW but it is interesting to see that large caps are gaining some steam while small caps are getting trounced. I have two charts posted on page two of my charts link that show the transfer of strength going from small caps to larger caps.

The larger story lies with crude oil as it hit an intra-week high of $79.86 while closing at $78.71. Crude showed a large intraday reversal on Friday but still closed with a slight gain for the day. It broke out above the $75 resistance this week and was helped by the tensions in the Middle East and growing tensions with Korea. As long as missiles are being fired in the Middle East (outside of Iraq), crude and gold will travel higher while stocks struggle to hold their ground.

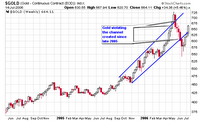
Gold reached a low near $550 but has now retraced about 62% and is trading back within the channel lines that date to 2005. Using retracement level logic, we would think that gold would pullback at this time but world tensions may change the formula and change human psychology.

All in all, we had a very negative week and I have no idea what next week will bring but I do know that I can’t lose much money because I don’t have much of it risked at this point in time. With that in mind, I am able to sleep at night without worrying if my account will be slaughtered tomorrow or the next day. I have moved portions of my cash to alternate investments while the market is taking its sweet old time to rally higher and urge you all to speak with your accountants and/or financial planners to do the same. These are not high interest investments but slightly better than the basic money market rates available. I have also been researching housing prices here in NJ because I know that the big builders are having trouble selling their back-log of homes. It’s still early in my opinion but I look to purchase several properties over the next few years to build an additional investment patch and/or income stream (this idea is still in the works).

Below is an updated look at the weekly averages for the NH-NL Ratio:
Saturday, January 14, 2006: 500-32
Saturday, January 21, 2006: 348-46
Saturday, January 28, 2006: 516-46
Saturday, February 4, 2006: 449-44
Saturday, February 11, 2006: 229-57
Saturday, February 18, 2006: 306-42
Saturday, February 25, 2006: 420-36
Saturday, March 04, 2006: 399-49
Saturday, March 11, 2006: 162-84
Saturday, March 18, 2006: 459-53
Saturday, March 25, 2006: 312-52
Saturday, April 01, 2006: 441-39
Saturday, April 08, 2006: 481-58
Saturday, April 15, 2006: 150-103
Saturday, April 22, 2006: 540-75
Saturday, April 29, 2006: 353-76
Saturday, May 6, 2006: 503-74
Saturday, May 13, 2006: 384-116
Saturday, May 20, 2006: 64-211
Saturday, May 27, 2006: 57-182
Saturday, June 3, 2006: 119-93
Saturday, June 10, 2006: 72-204
Saturday, June 17, 2006: 41-310
Saturday, June 24, 2006: 56-238
Saturday, July 01, 2006: 127-198
Saturday, July 08, 2006: 143-95
Saturday, July 15, 2006: 74-273 – This Week

As for new highs vs. new lows – here are the facts:
Monday showed a ratio of 102-147
Tuesday showed a ratio of 99-193
Wednesday showed a ratio of 90-185
Thursday showed a ratio of 43-386
Friday showed a ratio of 34-455

Piranha

MSW Mini-Screen: Top Stocks

Due the Mid-Week Special Screen on MSW last night, I promised members that I would post up a mini-screen that highlights some of the recent moves of our MSW Index stocks. Every one of these stocks has been actively covered since the initial coverage date listed below. As you can see, we have found many of the market leaders over the past several months as the major market indexes trend sideways to slightly higher. The MSW Index can hold up to 30 stocks at one time but has not held more than 25 all year due to the weakness in the NH-NL ratio (new high – new low ratio). The stocks listed below are among some of the top performers on the MSW Index in 2006.

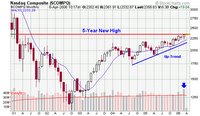
The NASDAQ hit its highest levels in more than five years while the S&P 500 reached its highest level since May 2001. Volume increased on the NASDAQ, giving us an accumulation day but volume fell among NYSE stocks (mixed signals across the broader market). The NH-NL ratio surpassed 500 and 600 new highs this week on separate days, the first time the ratio has done this since January 26 and January 27, 2006. The week ending on February 2, 2006 did have three days surpass 500 new highs but none of them crossed above the 600 new highs threshold.

The completion to the mid-week special screen will be uploaded tonight on MSW in part II of the daily screen exercise. If SWN fails to recover the 50-d m.a. and then slices back below the 200-d m.a., I will be buying the put options I spoke about earlier in the week. Another stock we have been talking about recently , AAPL (the former MSW Index tenant), received strong support at the 200-d m.a. and then released news yesterday that users can now run Microsoft windows on Intel based Apple machines using boot camp software. The stock rocketed to the 50-d m.a. and then surpassed it in early trading today. The charts were telling us that support was coming from somewhere but we didn’t know why until yesterday. The charts always tell the story before it hits the wire and this is why I don’t trade the news (it’s usually too late). See you all tonight.

MSW Mini-Screen
All prices are from the close on Wednesday, April 5, 2006:

  • PMCS – 13.25, the stock was up more than 8% on volume 115% larger than the 50-d m.a. Now up 16% on the MSW Index since 3/4/06
  • OXPS – 31.00, up 6.9% on volume 58% larger than the 50-d m.a. as the stock recovered the 50-d m.a. Now up 42% on the MSW Index since 11/12/05
  • TS – 202.24, up 6.33% to top $200 for the first time. Up more than 64% on MSW since 12/2/05 when we re-covered the stock at $123. We started our initial coverage last year in the $60-$100 run on 3/5/05 at $65.24 (a 210% gain). Moving up on the all-time MSW All-star list. If you thought buying the stock in the base at $123 was high; what do you think now at $200?
  • STRL – 23.30, up 5.72% on volume 30% larger than the 50-d m.a. as the stock is now up more than 23% on the MSW Index since 2/4/06
  • LVS – 60.71, one of the most recent additions to the MSW Index as the stock is now up 7% in one week on the MSW Index (looking for a $60-$100 advance this year).
    HAL – 77.34, one of the few energy stocks left on the MSW Index as it has gained 5.92% this week and has a total gain of 17% on the MSW Index since 12/10/05
  • NETL – 42.03, the up-trend is still intact as the stock looks to make another new high. The total gain is now 78% on the MSW Index since the first day on coverage on 11/12/05 at $23.56 (only five months).
  • NWRE – 30.15, looking to breakout from the most recent cup shaped base (without a handle at this point) to a new high. The stock is now up 49% on the MSW Index since 11/5/05
  • NTRI – 48.76, I hung tight with NTRI as it corrected to the lower half of the trading range but held above the support at $35. It is now up 14% on the MSW Index since 2/25/06. Looking for a new high above the previous high at $50.00 set in late January
  • GEHL – 40.39, profiled right here earlier in the week and covered on the MSW Index since 2/18/05 at $31.45 (lower than the pivot point of $35.15). A huge breakout this week as the stock has gained over 22% for the week and 28% on the MSW Index
  • CBG – 80.70, the stock has now completed half of the $60-$100 run and is nearing a long term capital gain on the MSW Index since its initial coverage on 5/21/05 at $37.20 (a 117% gain).

Piranha