Possible Short Setups

I will start by saying that I am not a professional “day” trader but I am looking to move in that direction and will start to test out my skills with basic technical analysis setups. I figured I would start with the first setup explained in John Carter’s book, Mastering the Trade; see my post from Monday.

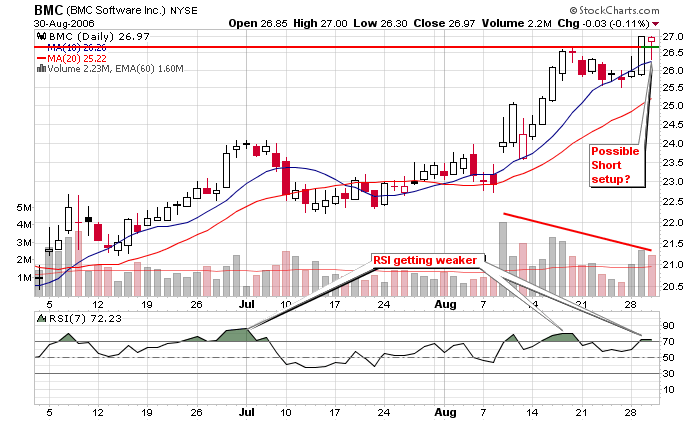
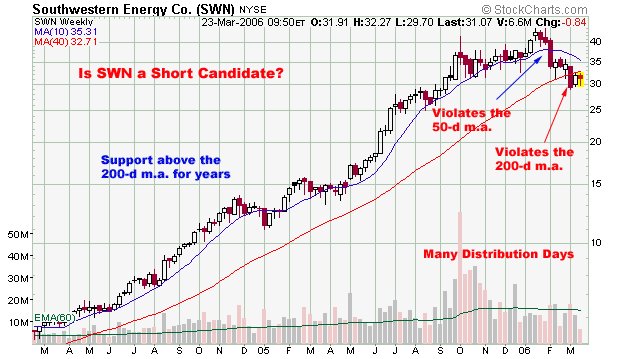
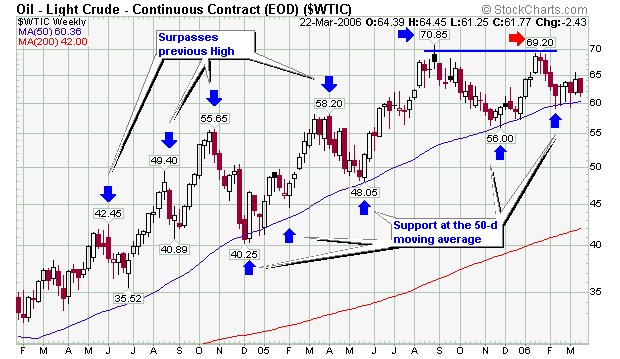
I am posting up four charts of stocks making new 52-week highs but have made these highs on lighter volume and with a weaker RSI. The RSI is actually making lower highs as the stock moves to higher highs which creates a bearish divergence.

Comment on my charts and give me your thoughts. I will disclose that I have already established a position in at least one stock and may establish another position today. The name of the stock is not important as I am just testing some strategies.

Click the charts to enlarge them!

Enjoy,
Piranha

Update: SWN short play

I spoke about a possible short position in SWN back in March on MSW and highlighted the chart analysis on this blog: SWN a Short?

I said: “The short position or put options can be placed (or bought) right now but I must warn that oil is still trading above its respective 200-d m.a. Unless oil cracks $60 and breaks below its own moving average, this play may not work out. If you initiate the position, make sure you use the correct position sizing techniques and protect yourself from a move to the up-side.”

Two things happened: oil didn’t violate $60 and is still above $70 a barrel and SWN was immediately in the red on my put options. Looking at my trade journal, this is what I wrote for the position:

“3/15/06: SWN Sep, 2006 35 put, shares price: $31.18, option price: $6.20, looking for moving average breakdown or drop to $20”

Monday’s price closed at $25.88 (with the options trading at $9.60 per contract), its lowest level in a year (the stock did exactly what I anticipated over the six month stretch even though it looked like a bust during the first few weeks). If this was pure stock short, I would have covered when it went against me but I never sold the options due to the longer term outlook I took (6-month window). As many of you know, I typically purchase options for stocks in the $60-$100 run with a 9-12 month time frame (many of these options double or triple within the first few months and I close the position long before the 12 month expiration). Tenaris was a great example as I closed the options above $37 (from $12) and then went on to watch them soar to $97 per contract.

This position is one bright spot for me in the midst of everything happening in the weak market environment. These contracts are now showing a 50% profit so I will start to contemplate scaling out of the contracts and locking in gains today.

Piranha

Southwestern Energy (SWN) a short?

Looking at a multi-year chart, you would not want to challenge the institutional support that Southwestern Energy Co. (SWN) has received for the past several years at the 200-d moving average. The stock has increasing quarterly and yearly earnings.

Yearly EPS:
2003: 0.37
2004: 0.70
2005: 0.94
2006: 1.23 (E)
2007: 1.56 (E)

Return on equity has been average when compared to its peers but not overwhelming. Revenues are rising and the debt-to-equity ratio is below the industry average. Above all else, it resides in an industry group that has been leading the market for the past two years while oil prices continue to increase and trade above $60 a barrel.

So why would I consider shorting the stock or buying several put options?
For starters, it violated the 200-d m.a. for the first time in almost three years.
It attempted to recover the moving average and failed, another event that hasn’t occurred in years.

The short position or put options can be placed (or bought) right now but I must warn that oil is still trading above it’s respective 200-d m.a. Unless oil cracks $60 and breaks below its own moving average, this play may not work out. If you initiate the position, make sure you use the correct position sizing techniques and protect yourself from a move to the up-side.

It’s ok to be wrong but its not ok to be wrong and sit without getting out of the position. If (SWN) fails to recover the 200-d m.a. once again, this will be a strong signal to place the position if you don’t do it before then.

Good luck, we’ll see what happens.
By the way, I am not bearish or bullish on the market, I am just searching for opportunities.


Piranha

Top 10 Shorting Opportunities on MSW in 2005

MSW follows the trend and isn’t shy from covering stocks that I feel will drop in price. Late last winter (2004-2005), I turned bearish and started to cover stocks that I felt would drop in price and present us with shorting opportunities. I am bullish by nature as are most humans but I am also in the market to make money so I must follow the path of least resistance. The table inserted in this blog post shows us the top shorting opportunities on MSW in 2005.

You will notice that we stopped covering our short stocks at the end of April 2005, precisely the time that many of these stocks bottomed before starting to move higher. I am not taking credit for calling the market low but my NH-NL ratio started to change direction so I quickly changed my perspective. The NH-NL ratio nailed this low on its head!

The week ending on 4/30/05 had a NH-NL ratio list that looked like this:
Monday showed a ratio of 92-142
Tuesday showed a ratio of 76-204
Wednesday showed a ratio of 64-296
Thursday showed a ratio of 66-336
Friday showed a ratio of 68-341

The following week (5/7/05), the week I started to turn from bearish to bullish looked like this:
Monday showed a ratio of 105-176
Tuesday showed a ratio of 97-159
Wednesday showed a ratio of 128-121
Thursday showed a ratio of 152-85
Friday showed a ratio of 141-106

I also started the 5/7/05 weekly screen with this quote:
“Last week we highlighted a “sea of red flags” while this week we will highlight stocks that are showing solid relative strength versus their peers and the rest of the market. Typically, stocks that show the strongest characteristics and relative strength during corrections, bear markets and sideways markets, are usually the stocks to lead the next rally.”

Stocks that were making screens at this time were HANS, CBG and TS and they all became leaders.

My three prime tools for conveying market direction are:
1. Price and Volume of the Major Indexes
2. NH-NL Ratio
3. Behavior of Individual Stock Market Leaders

Piranha

What describes a “qualifying” stock for shorting?

…I was asked these series of questions today by a fellow member:

“I am your subscriber and I am wondering about your choices for a short? You wrote on Daily Screen for: 04/18/2005 “We do not recommend buying anything in the current market environment unless you are establishing a short position in a qualifying stock.”

What describes a “qualifying” stock for shorting?

Some stocks you mentioned have good fundamentals. Why would you like to short stocks with good fundamentals at all? Isn’t it more logical to short stocks with weak fundamentals and weak technicals?”

To start, please read the two part series on shorting stocks in this blog to understand what the qualifying characteristics are for these types of stocks. These two very informative articles were written last month on March 16th and 18th.

Shorting Stocks – The Basics, Part I of II …What does it mean to short a stock?
Shorting Stocks – The Basics, Part II of II

Now that you have read or re-read those two articles, I will now refer back to another great article that I wrote back on February 21, 2005, titled: Fundamentals are late to the Party.

In this article I said “A stock usually breaks down well before the actual fundamentals turn negative and official news hits the street. Insiders always start to sell when things are looking down or sales are not expanding. This poses a problem for the individual investor because they won’t know about poor sales or earnings until the official news is published or the company changes their outlook in a conference call, months after the problem has already developed.”

This member is correct by asking the question about solid fundamentals but we all must remember that fundamentals will stay positive much longer than the technical indicators. Ideally, deteriorating fundamentals are preferred over superior fundamentals but it is not as important as we all would like to think. Leaders from six months ago are typically the stocks that will start to fail today (especially in the weak environment), setting up for nice profit opportunities using a shorting strategy. The charts will show us reversals, trend-lines breaking and moving averages being sliced. We also must remember that 75% of all stocks will follow the general trend of the major indices and that has been a pure sideways correction in 2005.

For example, EBAY still has solid earnings and sales but the stock price has dropped almost 50% since December and 33% over the past couple of months since placed on our Red Flag screens. The market is usually priced into a stock approximately six months in advance. The market anticipates what the stock will be doing six months from now and that is why you must use both fundamental and technical analysis when making decisions based on future movements. If you go back and see some of the best shorts of all time, their fundamentals were still great as they were breaking down and becoming prime short candidates.

The only way we can assess the direction of a stock is by the underlying trend that is established on the charts. We confirm these trends with volume because we know that only institutions can develop moves powerful enough to spike volume levels above average on a daily and weekly basis. What individual investor do you know that trades millions of shares a day, every day in eBay? No one! The institutions drove down eBay’s stock over the past 5 months based on future expectations and speculation of slowing sales. They were right and the stock dropped.

Recently I have screened the builder stocks as red flags even though their fundamentals are still superior. With recent drops below their 50-d moving averages and breakdowns on the point and figure charts, I calculated that something is changing within this industry. Since making our red flag screens last month, they have all recorded double digit losses. There are two reasons for this:
The market is very weak and the “general trend” is negative
The industry is boasting late stage bases while interest rates are rising and fears of inflation are growing.

If anyone has more questions on this subject, please post them to the comment link below on this blog article and this discussion and lesson will continue.

Piranha