CMG starting to look like CROX

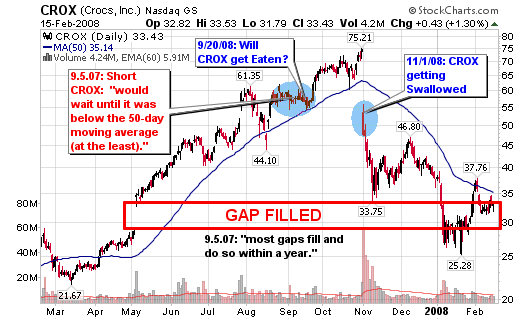
The weekly chart of Chipotle Mexican Grill (CMG) is starting to breakdown in a similar way that CROX broke down but the institutional numbers don’t support the down side as strongly as it did with CROX. The number of shares sold exceeded the number of shares bought by 46% when I highlighted CROX as a potential breakdown stock back in September in the post titled “Will CROX get Eaten?”

“Recent churning action below $60 per share shows that buyers are no longer in control of the stock. However, sellers haven’t completely gained control either. It is a tug-of-war between supply and demand as we await the ultimate direction of the next trend for the heavily covered Crocs Inc. (CROX).”

021808_cmg_wkly.png

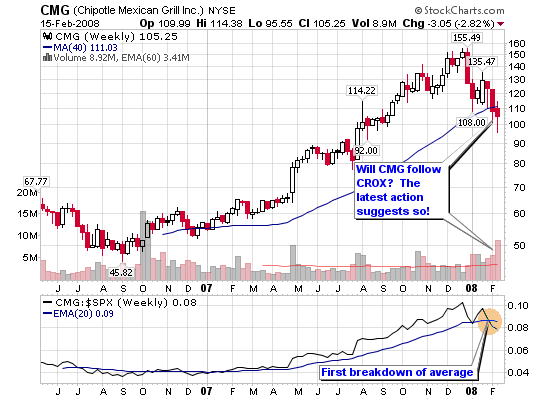
The difference here is that CMG has only recorded a 19% increase in shares sold versus shares bought which is not excessive. However, the stock has violated the 200-d moving average for the first time since the long up-trend started. We can also see the first violation of the relative strength versus the S&P 500 suggesting that the stock is no longer a leader and may fall victim to increased institutional selling.

Yes, the current fundamentals look strong but CMG posted a fourth-quarter profit that missed Wall Street’s expectations and said 2008 would remain challenging, raising some red flags in my opinion. They could be playing it cautious or they could be signaling the beginning of the end of this particular run.

The stock is 32% off of its all-time high and has been falling on increasing volume as it violated the long term moving average. I am not shorting at this spot but I will jump on puts about six months out on the first failed attempt to make new highs above the 200-d m.a.

Listen to what the Institutional Buyers are Saying (with their actions):
Total Held by Institutions: 386
Money Market: 182
Mutual Fund: 200
Other: 4

New Positions: 107
Positions Sold: 58
Shares Held: 29.28 mil
Shares Held Previous Period: 30.12 mil

Shares Bought: 4.31 mil
Shares Sold: 5.16 mil
Value of Shares Bought: $554.8 mil
Value of Shares Sold: $663.9 mi

  • The number of shares held has decreased by 3%
  • The number of shares sold exceeded the number of shares bought by 19%
  • The value of shares sold was $109 million more than bought

It took a couple of months but CROX did get Swallowed and it all started with the small and subtle red flags that we are starting to see with CMG.

“I wrote a post titled Will CROX get Eaten? on September 20, 2007 and strongly noted the declining institutional support (see numbers below). Someone was jumping out of the stock and we now know why!”

“Stocks only churn when buyers and sellers are struggling to take control. More often than not, stocks churn because BIG institutions are selling shares to the small retail buyer (the sucker). Institutional numbers and charts that back them up don’t lie! The big boys can’t hide if you know how to read them.”

021808_crox_daily.png

Inverse ETFs Paying Off

The Inverse ETFs that I highlighted in October are really paying off with an average three month gain of 21%. I will admit that I didn’t buy any of them but I know several readers that were real excited about their potential and their ease of use.

012408_qqqq.png

Many traders are turned off by the complexities of shorting or just don’t feel comfortable about the process so Inverse ETFs present them with a simple solution. Trading Inverse ETFs allows traders to place an order that mimics the buying and selling process of a regular stock but you are now betting the short side instead of the long side. These trades allow the investor to ride the market down without the complexities or uncomfortable jitters of shorting.

As I wrote in October, Inverse ETFs are specifically designed to move in the opposite direction of the underlying market index. Thus, if the Dow Jones Industrial Average declines by 1 percent, its inverse ETF (the Short Dow 30 ProShares Fund, symbol DOG) will rise by 1 percent. When the S&P 500 falls by 1 percent, the Short S&P 500 ProShares Fund (SH) will rise by 1 percent.

Take a look at the gains of the four ETFs I highlighted prior to the market opening on October 17, 2007:

  • DOG: 17.47% peak gain this week
  • SH: 19.21% peak gain this week
  • PSQ: 22.83% peak gain this week
  • RWM: 23.07% peak gain this week

I don’t recommend jumping into these ETFs right this moment (the previous opportunity was in October when I presented them) but keep an eye on the market and look to pounce when the major indexes bounce higher and start to show overbought signs. Be patient just as you would with trades on the long side.

012408_dog.png

012408_sh.png

012408_psq.png

012408_rwm.png

Cramer YELLED Buy, I wrote Sell

Jim Cramer was yelling about buying overvalued stocks on October 31, 2007 while I was continuously writing about selling, distribution days and taking profits. He also predicted that the banking stocks would be the top performers in 2007 – go figure (at least he paid his $50k bet for losing that prediction). YES, I did upload daily screens and stocks with the strongest relative strength ratings so I am not the superhero of calling this first bear market push but I feel very good about what I wrote (especially since the number of readers continues to increase – that says it all).

012308_cramer_buy.png

Looking back, I offered at least a dozen high quality, highly detailed articles about some type of selling, profit taking or market distribution days. Shame on anyone (including me) that ignored the signals as they slapped us in the face, week after week!

Take a look at some of the highlighted articles I wrote as the market was topping. I think this list contains some of the best work I have ever done on this blog or my former equity research website. Finding growth stocks and presenting them during an up-trend is the easy part. Selling and profit taking is the hard part; let me correct myself – selling is the hardest aspect to grasp when trading (in my opinion of course).

A Review of Articles Talking about Selling, Profit Taking and Market Distribution:

  • 10/03/07: Is Shanghai a Nasdaq Déjà vu

    Well, the current two year rise of the Shanghai Stock Exchange Composite Index looks remarkably similar to the rise of the NASDAQ of the late 1990’s and the charts below explain better than I can!

  • 10/04/07: A Technique for Profit Taking

    What do you do in a market like today when you have profits in multiple positions but you don’t want to give it all back? You want to continue to ride the winners but at the same time, you want to maintain the unrealized gains in your account. HOW?

  • 10/12/07: Distribution Day

    This was the largest showing of volume in two months and is not healthy because it was pure distribution. It was only the second distribution day over the past month so we can’t call this a bear run but please be on the lookout for a possible correction of 5%-10%. Technology stocks led the decline as BIDU gave back 10% of its amazing run.

  • 10/15/07: How to Make Money Selling Short
  • 10/17/07: Inverse ETFs

    Have you ever wanted to short the market because you knew it was going down but your were too overwhelmed, nervous or even scared because you were unsure of how to do it. Well, Inverse ETFs may be your thing.

    These inverse ETF’s closed Wednesday with gains of 13.42%, 15.43%, 22.31% and 18.76% since I wrote about them.

  • 10/18/07:The Real PTR Climax Run?

    I was early in September by trying to locate a climax run in PTR in this post:
    Petrochina (PTR) Climax Top? However, the HUGE volume on the latest push to new highs clearly indicates something is going on.

  • 10/20/07: Second Major Distribution Day

    Technically speaking, we now have 4 distribution days for the NASDAQ and 3 for the DOW over the past month. It’s now time to start focusing big-time on the market leaders to see where they are going to take this market. If they start to roll over, you better be quick to take profits and even quicker to take losses.

  • 11/01/07: CROX getting Swallowed

    I wrote a post titled Will CROX get Eaten? on September 20, 2007 and strongly noted the declining institutional support (see numbers below). Someone was jumping out of the stock and we now know why!

  • 11/08/07: Market Corrections, Bears and the Big Picture

    Keep in mind that nearly 75% of all stocks follow the general market trend. Your cash doesn’t need to be committed to the market at all times. This philosophy is suited to making the most money in bull markets or markets trending higher.

  • 12/11/07: When to Sell

    Why do so few books exist on the subject of “How to Sell”? Selling techniques are far more complicated than buying techniques and subject to considerably more emotional pressure, than those of buying.

012308_cramer_top.png

I promise that I will get back to analysis and uploading charts by next week the latest. That’s what I love doing most anyway and it seems to be the biggest draw in traffic.

Setups for Selling Stocks Short

I wrote an article on October 15, 2007 titled How to Make Money Selling Short, precisely when the general market indexes were topping. I am not going to take full credit but subconsciously my charts were giving me signals that the market was showing the major red flags and signals of what we are seeing today. This is a direct quote from that blog post from three months ago:

I have (privately) screened several potential shorts over the past couple of months but this market is not ready to roll over just yet. I was early with my shorting analysis in 2006 so I do not want to make the same mistake in 2007. However, more and more stocks seem to be building bases like the ones from the bubble burst in late 1999 and early 2000 (examples in the charts provided).

When I short stocks, I look for longer term trends, not short term swing trades (rarely ever day trades). The shorts I want look like the charts in this post (they take months or even years to complete). I want the high flyers that will be crushed over the next several months. Just as I like riding trends higher, I like riding trends lower over the intermediate to long term (4-12 months). I am trend trader at heart and it is what I do best.

We will have bounces to the upside over the next few months and the Fed will try to stop the bleeding but the stocks that are due for crushing blows will be dealt those blows eventually and we all can profit from them. Stocks may move 20%-50% (in both directions) at times so be careful. I will spend the remainder of the week posting up charts that look ready to become long term losers. Charts similar to the examples below. Give the charts time to form, be patient because many of these will look to move higher at times (as soon as this week and next) prior to their inevitable fall.

Complete Blog Post Repeated from October 15, 2007:
The title of the post is borrowed from the book “How to make Money Selling Stocks Short” by William J. O’Neil. It’s an ideal book for investors that focus on trading longer term trends and don’t necessarily do this for a profession (i.e.: day traders).

The book contains some excellent strategies for finding prime shorting candidates or stocks that are about to enter a declining stage that may offer excellent risk/reward setups for buying put options.

(CLICK FOR LARGER IMAGES)
101507_csco_short_sm.png

I consider several of the techniques in the book to be reverse CANSLIM? Study the charts from the past that have setup ideal shorts and then screen for those same characteristics in stocks trading today. Many of the ideal shorts from past market declines have held the reverse characteristics of an ideal CANSLIM stock (that you would want to buy).

Many traders believe that the most obvious area to place a short would be near the peak of stock’s trading range but studies have found this to be untrue.

101507_jdsu_short_sm.png

Characteristics of Longer Term Trend Shorts

  • Most ideal longer term “trend” shorts take four to twelve months after the peak price to setup on the weekly chart with the majority of these shorts triggering between six to nine months.
  • Look for stocks that had prior up-trends and support levels that can now act as downward resistance or entry areas.
  • Once a stock tops and starts to consolidate, you want it to slice through the 50-d moving average and then the 200-d moving average.
  • A crossover between the 50-d m.a. and the 200-d m.a. is ideal and is graphically presented on each chart in this post
  • The odds of success increase with each failed attempt for the stock price to recover these major long term moving averages.
  • Head and shoulder tops can also serve as ideal setups for potential shorts if they take at least five months to develop.
  • A decreasing relative strength line and a negative pattern on the point and figure chart can also confirm that the stock is rolling over and setting up an ideal short.
  • Finally, volume should be increasing and the stock should be under distribution as it violates the major moving averages and starts to break former support levels.

[Read more…]

Inverse ETFs

Have you ever wanted to short the market because you knew it was going down but your were too overwhelmed, nervous or even scared because you were unsure of how to do it. Well, Inverse ETFs may be your thing. They have been around for more than a year but are starting to gain some popularity as volume has been increasing in recent months.

SFO Magazine has an article this month titled:
The New Kid on the Block: Day Trading with ETFs
by: Ken Tower

101707_qqqq_psq.png

In the article, Ken has a section titled Inverse ETFs—A Dream Come True and goes on to speak briefly about them:

Traders have long had the ability to sell short stocks or buy put options in order to profit during market declines, but the recently introduced inverse ETFs make the process much easier and, for me, represent a dream come true.

Short selling is a messy business that never caught on with most traders. One has to open a margin account, make sure the stock is available to borrow and worry about it being called back unexpectedly. ETFs can be sold short (and are exempt from the uptick rule), but the idea of selling high and buying low remains unpopular.

The new crop of short ETFs solves this problem. They are specifically designed to move in the opposite direction of the underlying market index. Thus, if the Dow Jones Industrial Average declines by 1 percent, its inverse ETF (the Short Dow 30 ProShares Fund, symbol DOG) will rise by 1 percent. When the S&P 500 falls by 1 percent, the Short S&P 500 ProShares Fund (SH) will rise by 1 percent. That’s right, the inverse ETF goes up in price. See Figures 1 and 2. This is excellent because it’s exactly with what traders are familiar—stocks that go up. By reviewing both the long ETF and the short ETF of the same market average, one may gain additional insight into the market direction.

“Take a look at the DIA, SPY, QQQQ or IWM (Russell 2000 ETF). If those don’t look attractive, their inverse funds (DOG, SH, PSQ and RWM) are likely to impress.” – Ken Tower

[Read more…]