Position Sizing and Expectancy

So where does system development start?

Investors will be prepared to trade in situations when the odds are in their favor by properly understanding position sizing techniques and calculated system expectancies. A system that has been tested will have an approximate expectancy that will tell the trader how much will be gained or lost during each trade over a period of time. Using this knowledge, the investor will determine how much risk to undertake by calculating a position sizing algorithm which tells you how much to place on a specific trade. The word ‘algorithm’ sounds scary but I have developed very simple position sizing and expectancy spreadsheets that can be found through the links below. They can be downloaded, studied and tweaked without any advanced spreadsheet or mathematical experience.

Most traders look for three major factors when developing a system:

  • How much to trade on each position
  • The right odds or positive expectancy
  • Number of trades or how much opportunity the system presents

How do we Calculate Position Size?
We can determine how much to place on each trade by assuming a $100,000 account with 1% risk on each position. Using a basic trading approach, I will place my stops approximately 8% below the ideal entry area or pivot point. Please use more advanced methods for locating the ideal stop rather than a general 8% (I am doing this for example purposes only). Look for the ideal risk-to-reward setup based on recent support and resistance levels and set your stop and potential target accordingly.

$100,000 Account
1% Risk = $1,000
8% Stop Loss
Position Size will be $12,500

We calculate the position size by dividing the 1% risk by the 8% stop loss or $1000 / 8% = $12,500.

If the stock we are watching has an ideal entry of $50, we now know that we can buy 250 shares or $12,500 worth of stock. Our stop loss is $46 or 8% of $50 and our maximum loss is $1,000 of the original $100,000 portfolio.

What exactly is expectancy?
Expectancy tells you what you can expect to make (win or lose) for every dollar risked. Casinos make money because the expectancy of every one of their games is in their favor. Play long enough and you are expected to lose and they are expected to win because the “odds” are in their favor. Most games at a casino are completed in a short period of time so they can increase their odds of winning.
[Read more…]

How to Add Shares to a Profitable Position

MSW Member Question:

I had a question about position sizing. Let’s say that you have a stock in your portfolio that is up 30% then forms a base/consolidates to a moving average, and you want to add to this position. How would you go about doing this? I know that you’re supposed to add less shares when pyramiding up, but would this be considered a second position according to position sizing techniques? Or would you only initially add 2/3 to a position when the stock breaks out then the additional 1/3 if it pulls back?
Thanks

My Answer:

There are a few ways that I have approached this situation. Some of you may agree and some of you may disagree with the way I pyramid or scale my positions when they are in confirmed up-trends after my original entry. When the market is weak and the NH-NL ratio is not confirming a bull market such as 2005 and 2006, I am cautious when I enter a position making a new high. Hypothetically speaking, I will use a $100,000 portfolio and round numbers to keep the examples simple although the CBG position explained in detail is based on a true position.

If I start to research a stock and feel it will travel from $60 to $100, I will determine the maximum position I can assume from a simple position sizing calculation. If I determine I can handle an 8% drop, I am allowed to purchase 208 shares at $60 per share (I’ll typically round it off to 200 shares in this situation). My position size will be $12,500 with a maximum drawdown risk of $1,000 or 1% of my entire portfolio. My stop will be located at $55.20 or slightly beneath a specific support area that is within 8% of my purchase price. If the stock is breaking out of a specific pattern such as a cup with handle, I will buy half my position at the time of breakout and the other half after the trend is confirmed several days later.

If the stock is in a solid up-trend and not in a recognizable pattern, I will typically purchase 2/3rd of the position when I see the opportunity and then follow up with the remaining 1/3rd of the position at the time of the next pullback (only after the stock reaches a minimum gain of 25%).

Other times, when the market is acting healthy and the NH-NL ratio is strong, I will initiate the entire position based on my original 1% position sizing model and reassess the situation at a later date. Using a recent example, I added shares to CBG when it consolidated in the $40’s and then readjusted my position sizing model to 1.5% (the math can become tricky at this point since the price has changed and my portfolio value is different). I have never gotten into this much detail in a simple blog post but I guess now is better than ever. This method is my own so you will not find it anywhere else and it may or may not appeal to everyone.

The following is a true example using actual stock prices but the portfolio size has been altered to keep the calculations simple and to keep my own activity discreet.

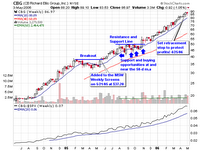
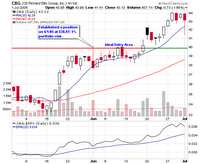
When I first purchased CBG, I took on the entire 1% portfolio risk and wasn’t sure if I would ever add shares in the future (this wasn’t my concern at the time). I liked the stock and thought the 15 week pattern that preceded my buy was picture perfect (especially since the correction was due after the prior up-trend from the IPO date). I placed a market order on June 1, 2005 at $38.97 for the entire risk amount of 1%. The stock was already under coverage on the MSW Index since May 21, 2005 at $37.20 but I was looking for a break above $39. I used the calculation of $39 which gave me the purchasing power of $12,500 or 321 shares (my order was filled for 320 shares at $38.97 = $12,470). After I placed the position, the stock immediately reversed but I stayed put as it didn’t violate any sell signals and then watched as it quickly advanced into the $40 range and approached $50. The stock consolidated over the next three months as I held the position and started to cover it more heavily on the MSW Index with a new purchase price of $50. The resistance line was touched several times so I decided that I was going to add shares if the stock broke-out above $50 with confirming volume.

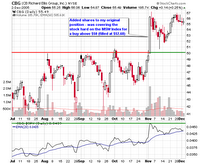
As it turns out, I did add shares when the stock started to form the obvious consolidation during the fall of 2005. I added shares on November 2, 2005 at $52.68 (a little higher than I wanted but it was an extremely powerful move that day). The stock hesitated slightly over the next several days but never violated the new support line of $50. Within six weeks the stock moved towards $60 per share and I felt very comfortable. So, how many shares did I buy and how did I determine the size of my additional position?

When pyramiding up, I have always been taught by my father to take on a smaller position than the original purchase. In this case, my portfolio had grown by about 10% since the summer so I decided that I could take on another 0.5% risk in CBG (a total risk of 1.5% – my maximum risk in any one stock caps at 2% of my entire portfolio). When running the new calculation, I had a portfolio size of $110,000 (hypothetical value) with a 1.5% risk factor or $1,650 risk on the entire position.

I used a price of $50 with a risk factor of 0.5% (half of 1%) with a stop of 8% (typical for my calculations) which gave me the purchasing power of $6,875 or 138 shares. I bought an additional 130 shares and added them to my original position of 320 shares for a total of 450 shares and a total cost of $19,318.80 (minus all fees, etc…). Now, take a look at how this works (it doesn’t work perfectly every time but this time I kept the numbers round): Using the position sizing calculator; plug in a portfolio value of $110,000, a risk of 1.5%, stop loss of 8% and an average cost basis of $45.83 (($38.97+$52.68)/2). What do you get? Amazing: a position size of $20,625 or 450 shares. I currently hold 450 shares with a dollar value slightly lower ($19,318.80) than the maximum calculation in this equation.

The support line is $50 but the stock went on to maintain the 50-day moving average as the true support line heading into 2006. I have not sold one share in this company as I approach one year of holding the stock from the original date of purchase. I will not base my sell on anything but my stop which currently resides slightly below the 50-day moving average. I have a tremendous gain in this stock and I owe it to two things: CANSLIM for finding the actual stock (strong earnings and a recognizable pattern setup) and position sizing for giving me the right amount of shares to purchase. By using the moving average and a retracement stop calculation, I know the exact location to take my profit. Also note that I will most likely scale out of the position if it starts to consolidate in a new range. This is a topic for another day! I always start with a 1% risk factor but will raise my risk factor to 1.5% or even 2% in rare situations when things are working out and I am placing good money after a profitable trade. Again, this is my own personal method so I advise that each individual use what works best for their own portfolio and test several scenarios.

I am open to questions if anyone has them!
Piranha

100 R Profits come from strict Money Management Skills

If you ever wanted to understand money management techniques used by professional traders, I highly recommend that you read the book Trade Your Way to Financial Freedom by Van K. Tharp. The position sizing calculator that I uploaded to this blog is based from the book and several of the money management techniques I describe derive from the fundamentals outlined by Dr. Tharp. Other techniques such as technical analysis, fundamental analysis, market psychology and historical wisdom come from the small selection of books that I highly recommend: Recommended Stock Market Books.

I read a fabulous post on another blog yesterday that jumped right into the key money management subjects covered by Dr. Tharp. Trader Mike is a day trader, something I am not, but I respect the way he handles his trading and actually share many common techniques although in different time frames. I don’t know much about day trading but I understand money management and this post may help many of you delve deeper into the study of proper money management techniques. The blog post, My Path to 100 R in Profits from Day Trading , also shares a bit of his psychological thought process as the he explains why his returns were hurt slightly at one point last last year and how he will correct that going forward.

Whether you day trade, trend trade, swing trade or even buy and hold for longer periods of time; proper money management techniques are a must and understanding your own investor psychology is key to becoming successful. Enjoy!

Piranha

Position Sizing Calculator

Here is a link to a simple position sizing spreadsheet that I put together that also includes a few trailing stops (based on the retracement method explained in the previous post).

Position Sizing and Stop Calculator Spreadsheet

Try this link also for a direct download (people that don’t use windows XP):
Position Sizing and Stop Calculator Spreadsheet

I will have a new page created and added to MSW with the calculator but this link should be sufficient for now. Click the button highlighted in the image to save the spreadsheet to your own computer.

Piranha

Position Sizing – Why Losing isn’t Everything!

I have been arguing (going back and forth) with a “so-called” investor on another forum and he questioned my trading methods and claimed I would lose 76% if I took 8 consecutive 8% losses. Knowing me, I had to breathe deeply, release the anger from a person who knows nothing about position sizing and teach him a simple math lesson. The following example is simplified to allow you to understand what is happening. In the real world, things are a bit more complicated with commissions, emotions, slippage and the like.

Enjoy the position sizing example. It shows you how you can lose 80% of the time (worse case scenario); yet still come out a slight winner.

If I start with $100,000 and lose 8 consecutive trades at 8% (only risking 3% of capital with 8% stop loss), this is what it looks like:
$100,000 portfolio
3% risk per trade
8% stop loss

1st Trade:
Risk will be $3000 = ($100,000*3%)
Amount to Trade at 8% stop: $37,500 = ($3000 / 8%)
An 8% stop loss will cost me $3000

2nd Trade:
Risk will be $2,910 = ($97,000*3%)
Amount to Trade at 8% stop: $36,375 = ($2,910 / 8%)
An 8% stop loss will cost me $2,910

3rd Trade:
Risk will be $2,822 = ($94,090*3%)
Amount to Trade at 8% stop: $35,283 = ($2,822 / 8%)
An 8% stop loss will cost me $2,822

4th Trade:
Risk will be $2,738 = ($91,267*3%)
Amount to Trade at 8% stop: $34,225 = ($2,738 / 8%)
An 8% stop loss will cost me $2,738

5th Trade:
Risk will be $2,655 = ($88,525*3%)
Amount to Trade at 8% stop: $33,198 = ($2,655 / 8%)
An 8% stop loss will cost me $2,655

6th Trade:
Risk will be $2,576 = ($85,873*3%)
Amount to Trade at 8% stop: $32,202 = ($2,576 / 8%)
An 8% stop loss will cost me $2,576

7th Trade:
Risk will be $2,498 = ($83,297*3%)
Amount to Trade at 8% stop: $31,236 = ($2,498 / 8%)
An 8% stop loss will cost me $2,498

8th Trade:
Risk will be $2,423 = ($80,798*3%)
Amount to Trade at 8% stop: $30,299 = ($2,423 / 8%)
An 8% stop loss will cost me $2,423

Total loss after 8 trades: $19,201
This loss totals 19% (minus commissions etc…)

TRADE #9:
Risk will be $2,351 = ($78,374*3%)
Amount to Trade at 8% stop: $29,390 = ($2,351 / 8%)
An 8% stop loss will cost me $2,351
**This trade ends with a 40% gain: $11,756 = ($29,390*40%)**

Original amount: $78,374 + $11,756 = $90,130

TRADE #10:
Risk will be $2,703 = ($90,130*3%)
Amount to Trade at 8% stop: $33,787 = ($2,703 / 8%)
An 8% stop loss will cost me $2,703
**This trade ends with a 30% gain: $10,136 = ($33,787*30%)**

Total portfolio worth: $100,266

WOW – a profit with 8 consecutive losing trades and 2 winning trades!
That is a 20% winning percentage but it gave me an end result of a slight profit!

This is how money management works!

Now just imagine have a winning percentage of 40% or greater and cutting some of those losses at less than 8%, your portfolio could easily gain 50% or more in one year with a 40% winning percentage based on simple position sizing!

This is how TRUE investors and traders take money out of Wall Street.
Piranha