New Highs and New lows telling a Story

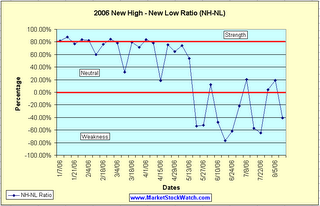
A few months back I asked if the New High – New Low Ratio (NH-NL ratio) was reliable. Take a look at the chart and the numbers and tell me what you think.

The chart in this blog entry was calculated using the simple math explained in an entry I wrote earlier in the year, which can be found here: Is the NH-NL ratio Reliable?

To calculate the percentage correctly, use this formula:
(New Highs – New Lows) / (New Highs + New Lows) * 100 = X%

The one thing I would like to stress is the huge drop from borderline “strength ratios” in April to negative weakness in May (just the time the market started to tell us all to get out and head for the sidelines and lock in gains).

Brett Steenbarger talks briefly about his findings while studying the new highs and new lows in the market. Take a moment to visit his “Market Context” for August 14, 2006 to see what he has to say.

I will conclude by saying that the NH-NL ratio is extremely reliable (lagging but reliable)!

Below is an updated look at the weekly averages for the NH-NL Ratio:
Saturday, January 14, 2006: 500-32
Saturday, January 21, 2006: 348-46
Saturday, January 28, 2006: 516-46
Saturday, February 4, 2006: 449-44
Saturday, February 11, 2006: 229-57
Saturday, February 18, 2006: 306-42
Saturday, February 25, 2006: 420-36
Saturday, March 04, 2006: 399-49
Saturday, March 11, 2006: 162-84
Saturday, March 18, 2006: 459-53
Saturday, March 25, 2006: 312-52
Saturday, April 01, 2006: 441-39
Saturday, April 08, 2006: 481-58
Saturday, April 15, 2006: 150-103
Saturday, April 22, 2006: 540-75
Saturday, April 29, 2006: 353-76
Saturday, May 6, 2006: 503-74
Saturday, May 13, 2006: 384-116
Saturday, May 20, 2006: 64-211
Saturday, May 27, 2006: 57-182
Saturday, June 3, 2006: 119-93
Saturday, June 10, 2006: 72-204
Saturday, June 17, 2006: 41-310
Saturday, June 24, 2006: 56-238
Saturday, July 01, 2006: 127-198
Saturday, July 08, 2006: 143-95
Saturday, July 15, 2006: 74-273
Saturday, July 22, 2006: 66 – 307
Saturday, July 29, 2006: 163-151
Saturday, August 5, 2006: 194-132
Saturday, August 12, 2006: 88-210 – This Past Week

New highs vs. new lows from last week (we were negative all week):
Monday showed a ratio of 83-147
Tuesday showed a ratio of 114-187
Wednesday showed a ratio of 126-235
Thursday showed a ratio of 62-281
Friday showed a ratio of 53-198

Piranha
New Lows still larger than New Highs

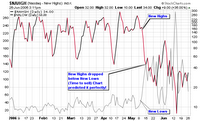
I dedicated a portion of this past Saturday’s weekly analysis to the NH-NL ratio; so I wanted to highlight the added chart that tracks the NASDAQ new highs and new lows at stockcharts.com. My weekly NH-NL ratio is compiled from IBD and stretched further than just the NASDAQ.

Prior to Today (Monday, June 26, 2006), the NH-NL ratio has closed in negative territory for 28 of the past 30 days, the longest streak over the past several years (since the bear market). The previous long streak from 2005 lasted 13 days during the month of October when we had three consecutive negative weeks. We have now had 15 consecutive negative days ending this past Friday, the weakest in years. Five of the past six weeks have been negative for the longest stretch of weakness since MSW has been publishing screens in early 2004. This is the longest negative NH-NL ratio streak since late 2001 and early 2002. With all of this weakness, I am amazed at how well the markets have held up compared to the bubble burst of 2000 and the strong bear market that lasted for a couple years from 2000-2002. This can only mean two things: the market still has more downside or the market has strength that will eventually show up with the DOW possibly making a new all-time high and the NASDAQ moving to new 52-week highs. Wow, I guess anyone can predict that (I took both sides of the coin).

Whatever is in store for us, we must follow the rules and wait patiently until the NH-NL ratio returns to positive territory, the market highlights new individual leaders and the major indexes recover their long term moving averages. Until all of this happens, I will remain in cash with a few long-term option positions. Even though I added several new names to the MSW Index, it remains strictly a watch list at this time.

Below is an updated look at the weekly averages for the NH-NL Ratio:
Saturday, January 14, 2006: 500-32
Saturday, January 21, 2006: 348-46
Saturday, January 28, 2006: 516-46
Saturday, February 4, 2006: 449-44
Saturday, February 11, 2006: 229-57
Saturday, February 18, 2006: 306-42
Saturday, February 25, 2006: 420-36
Saturday, March 04, 2006: 399-49
Saturday, March 11, 2006: 162-84
Saturday, March 18, 2006: 459-53
Saturday, March 25, 2006: 312-52
Saturday, April 01, 2006: 441-39
Saturday, April 08, 2006: 481-58
Saturday, April 15, 2006: 150-103
Saturday, April 22, 2006: 540-75
Saturday, April 29, 2006: 353-76
Saturday, May 6, 2006: 503-74
Saturday, May 13, 2006: 384-116
Saturday, May 20, 2006: 64-211
Saturday, May 27, 2006: 57-182
Saturday, June 3, 2006: 119-93
Saturday, June 10, 2006: 72-204
Saturday, June 17, 2006: 41-310
Saturday, June 24, 2006: 56-238 – This Past Week

As for new highs vs. new lows – here are the facts from last Week:
Monday showed a ratio of 59-240
Tuesday showed a ratio of 43-278
Wednesday showed a ratio of 64-192
Thursday showed a ratio of 59-227
Friday showed a ratio of 53-253

Another thing that I noticed on a combo chart (I first noticed this by Matthew Frailey) was the possible switch of favor from small caps to large caps in recent weeks. As you can see from the second chart (which tracks large caps versus small caps), large caps are starting to gain some strength by violating the trend line that dates back several years to the bubble burst. This is a secondary indicator that can be helpful but never use it alone or as a decision maker without first reviewing the price and volume of the market and the NH-NL ratio.

Piranha

Is the NH-NL Ratio reliable?

Based from the blog earlier in the week, I have updated the NH-NL ratio chart using the latest figures from the weekly averages. As you can see, the NH-NL ratio has been playing see-saw with the 80% positive/neutral line. With the NH-NL ratio staying below 500 new highs per day, we should not expect the line to travel in positive territory.

If you are skeptical about the line plotting above the 80% positive level, let me remind you of early 2004 when the NH-NL ratio was still extremely powerful (the end of the 2003 bull run):

January 2004:
1/06/04: 856-11
1/08/04: 966-9
1/09/04: 823-11
Weekly average: 97.5%

1/12/04: 823-11
1/13/04: 684-8
1/14/04: 776-9
1/15/04: 788-5
1/16/04: 889-4
Weekly average: 98%

1/20/04: 1,142-8
1/21/04: 950-3
1/22/04: 846-7
1/23/04: 646-6
Weekly average: 98.5%

1/26/04: 796-7
1/27/04: 724-8
1/28/04: 511-9
1/29/04: 206-10
1/30/04: 286-5
Weekly average: 96%

The ratio started to turn neutral in March 2004 and we saw the first negative NH-NL ratio on April 14, 2004 when it finished at 102-135 (a major red flag). Looking at the chart for the NASDAQ (going back to 2003 and 2004), you can see that this ratio perfectly showed the start of the decline from March to August after the tremendous bull rally of 2003.

Now those are amazing and reliable readings!


Piranha

A Negative New High-New Low Ratio (NH-NL)

We witnessed our first negative daily New High–New Low (NH-NL) ratio since Wednesday, November 16, 2005 when it closed at 103-207. The NH-NL ratio closed at 88-93 on Tuesday as the market presented us with the fewest number of quality stocks making new highs since last year. I have been backing off of the idea that a “rally” has been forming as claimed by other market sources and I have pointed to my three main indicators to explain why I have been playing defense since early February. Below I have listed some of the quotes that I made on the weekly screen from 2/11/06. On Monday, the NH-NL ratio finished at 271-77.

I have pasted the weekly NH-NL numbers from that week in November to show you what the market looked liked back then.

NH-NL ratios from :11/14/2005 to 11/18/2005
Monday showed a ratio of 275-130
Tuesday showed a ratio of 152-183
Wednesday showed a ratio of 103-207
Thursday showed a ratio of 297-147
Friday showed a ratio of 415-106

Below is an updated look at the weekly averages for the NH-NL Ratio:
Saturday, October 1, 2005: 255-116
Saturday, October 8, 2005: 197-144
Saturday, October 15, 2005: 46-317
Saturday, October 22, 2005: 73-220
Saturday, October 28, 2005: 111-162
Saturday, November 5, 2005: 241-93
Saturday, November 12, 2005: 231-111
Saturday, November 19, 2005: 248-155
Saturday, December 02, 2005: 312-73
Saturday, December 10, 2005: 309-77
Saturday, December 16, 2005: 293-104
Saturday, January 7, 2006: 473-47
Saturday, January 14, 2006: 500-32
Saturday, January 21, 2006: 348-46
Saturday, January 28, 2006: 516-46
Saturday, February 4, 2006: 449-44
Saturday, February 11, 2006: 229-57
Saturday, February 18, 2006: 306-42
Saturday, February 25, 2006: 420-36
Saturday, March 4, 2006: 399-49

2/11/06 Weekly Screen Quotes:
“A few weeks ago, I held six traditional stock positions and have been forced to sell all but two positions.”

“As I said above, I have been locking in profits and moving to cash.”

“This week, the ratio averaged 229 new highs per day, the weakest number since the week of October 28, 2005 when we had a negative ratio. The new lows gave us the largest average since the week of December 16, 2005 when it was above 100 stocks per day. Above everything else, I turn to the NH-NL ratio to gauge the strength among the leaders and I allow the ratio to help me decide when it’s time to use margin and when it’s time to start moving to cash (and vice versa).”

The chart in this blog post shows a graph that highlights the strength and weakness on the NH-NL ratio during the second half of 2005. I will update the graph with the latest data and post it up tomorrow. To calculate the percentage correctly, use this formula: (New Highs – New Lows) / (New Highs + New Lows) * 100 = X%

Piranha

New High – New Low Ratio (NH-NL)

…The new high/new low ratio (NH-NL) ratio has been around for many years but different investors use this indicator in different ways. Some investors plot the ratio on a chart using the number zero as a neutral designation with positive numbers equaling more new highs than new lows and a negative number equaling more new lows than new highs based on a specified period of time. I have developed and used the NH-NL ratio in a completely different way from some of the more popular methods. I started to follow stocks making new highs while reading the paper Investor’s Business Daily many years ago. I didn’t use the news highs as an indicator but I only studied stocks to buy from the list. As I became a more experienced investor, I subconsciously started to gauge the market while noting if the new highs were increasing or decreasing. After the stock market bubble burst in 2000, I started to record the difference between the daily new highs and the daily new lows. I would enter them into an excel sheet along with the price and volume of the major market indices and study their relationship. Within two years, I was convinced that the major market tops and bottoms could be located easily by aggressively studying the price and volume of the major indices and studying the ups and downs of the NH-NL ratio. The general market indices often give investors false moves in all directions and many market services and investors have developed new indicators to help assess the market to try and pinpoint turning points without great success. Many of these secondary indicators are successful in showing the investor if the market is weak or strong but they fail to pinpoint the strength or weakness of a turning point with great accuracy. Many of these secondary indicators give false signals along with the general market indices.

With several years of serious study under my belt using my method of the NH-NL ratio, I have accurately protected my money during downturns and have accurately guided my buys when the market has reversed and started a new sustained up-trend (not a head fake).

How do I use my NH-NL ratio?

I start by recording the daily new highs and new lows from Investors Business Daily (my preference) but you could use any free or paid service on the web. Over the past five years, I have developed key levels that the market must reached or violate to trigger certain actions. I am not pulling any of these numbers from thin air as they are all based on actual experience and have not been derived from back testing. For a market to convince me that it is following through and is starting a new up-trend, it must present me with a minimum of 500 new highs per day on a consistent basis. When a week ends, I add the weekly NH-NL totals and divide by the number of active trading days to get the weekly average. The average must have a minimum of 500 stocks per day for me to consider risking over 50% of my cash in new positions (the new leaders). Once the weekly averages reach 800-1,000+ stocks per day, we know that the market is in a full fledged rally and you can start to commit your entire trading stake and use margin. In 2003, the market gave numerous instances when the new highs topped 1,000-1,200 stocks per day, a very impressive amount. When the market shows strength like this, the trend has become obvious and you must have your money working for you by following the trend. Keep in mind that 75% of all listed stocks will follow the general trend of the market.

Recently in September and October of 2005, the NH-NL ratio has been negative, meaning that we are seeing more new lows than new highs. When this type of action happens, you must lock in profits and move your cash to the sidelines. It is not safe to invest on the long side of the market when the ratio is negative. Often times, a bear market may be forming when the ratio weakens and turns negative. If the market confirms a bear market or down-trend, it can be an opportune time to make money shorting stocks or using advanced strategies with options (I only recommend this for advanced and experienced traders). You must determine f the market is in a down-trend or if it is trading sideways. If it is trading sideways, it will be better to pull your cash to the sidelines and wait for a direction to form (either up or down). This article is being written and published on October 25, 2005, the first day after the NH-NL ratio has turned back to the positive side after 13 consecutive days of a negative ratio. The past two weeks have averaged negative ratios with some days only reaching 15 quality new high stocks. This type of weak action could signal a bottom in the market as we get ready to form a new rally. The most crucial indicator to watch over the next few weeks will be the NH-NL ratio to see if it can continue to gain strength and increase the new highs to 500 or more stocks per day. If this happens, the current indication that a rally has formed on the major indices will be confirmed and you can start to commit more than 50% of your trading stake to new leaders breaking out of sound bases or stocks moving higher from establish support areas.

As I look back at my archived hard copies of IBD, I can see the strength and weakness that this ratio gave us throughout 2002 and 2003. I am reminded how the ratio went from negative territory in September of 2002 to a positive ratio in October of 2002. After reaching positive territory, the new high ratio soared into the 800-1,100 range in the first six months of 2003 as we were in a strong bull market, the strongest year since the bubble burst. I don’t know what next month or next year holds for investors, but you can get a good idea by tracking this indicator as it turns back to the positive side after a very poor October (2005). I once wrote about the Halloween indicator and I am now convinced that it has some validity, especially if this NH-NL ratio confirms another rally as October draws to a close.

Piranha