Use PEG Ratio instead of P/E Ratio

PEG Ratio
A PEG ratio cannot be used alone but is a very powerful tool when integrated with the basics (price, volume and technical analysis). You must enjoy crunching numbers and have a calculator or spreadsheet handy to estimate your own PEG ratio. Access to quality statistical information from the web such as past earnings and future earning estimates is essential to calculate this fundamental indicator. A variety of websites produce a PEG ratio but I have not found one site that has a reliable PEG ratio that I can use for my own research, so I calculate it myself, ensuring accuracy with the final number. Besides, I don’t know what earnings numbers these sites are using to determine growth rates and price-to-earnings ratios.

Investopedia.com:
“The PEG ratio compares a stock’s price/earnings (“P/E”) ratio to its expected EPS growth rate. If the PEG ratio is equal to one, it means that the market is pricing the stock to fully reflect the stock’s EPS growth. This is “normal” in theory because, in a rational and efficient market, the P/E is supposed to reflect a stock’s future earnings growth.

If the PEG ratio is greater than one, it indicates that the stock is possibly overvalued or that the market expects future EPS growth to be greater than what is currently in the Street consensus number. Growth stocks typically have a PEG ratio greater than one because investors are willing to pay more for a stock that is expected to grow rapidly (otherwise known as “growth at any price”). It could also be that the earnings forecasts have been lowered while the stock price remains relatively stable for other reasons.

If the PEG ratio is less than one, it is a sign of a possibly undervalued stock or that the market does not expect the company to achieve the earnings growth that is reflected in the estimates. Value stocks usually have a PEG ratio less than one because the stock’s earnings expectations have risen and the market has not yet recognized the growth potential. On the other hand, it could also indicate that earnings expectations have fallen faster than the Street could issue new forecasts.”

012507_tam_weekly.png

PEG Ratio Example:
TAM S.A. (TAM)
Yahoo Company Profile: TAM S.A., through its subsidiaries, provides scheduled air transportation services in Brazil and internationally. The company engages in the transportation of passengers and cargo within Brazil and on international routes. It offers flights serving various destinations in Brazil, as well as operates scheduled passenger and cargo air transport routes to 46 cities, in addition to a further 27 domestic destinations that the company serves through regional alliances with other airlines.

First, you will need to gather the past earnings numbers; going back a couple years and going forward a couple years. Keep in mind that the numbers going forward are only estimates and that is why this is only a secondary tool to help predict a future price or target.

TAM Earnings:
2005: 1.30
2006: 2.58
2007: 2.86
2008: 3.14

We need to calculate the growth from year to year.
Subtract the earnings of 2006 by 2005 and then divide by 2005.
Repeat the process to determine the growth rate for the following years:

2006: (2.58-1.30)/1.30 x 100 = 98% growth rate

2007: (2.86-2.58)/2.58 x 100 = 11% growth rate

2008: (3.14-2.86)/2.86 x 100 = 10% growth rate

Take the current price (we will use the close from Wednesday, January 24, 2007: $32.62) and divide it by 2006 earnings and then by the 2006 growth rate:
2006: 32.62/ 2.58 / 98 = 0.12 PEG Ratio
2007: 32.62/ 2.86 / 11 = 1.03 PEG Ratio
2008: 32.62/ 3.14 / 10 = 1.04 PEG Ratio

Using the definition from above, Investopedia states that a stock is evenly valued at a PEG ratio of 1 in a rational and efficient market. Please note that the stock market is not very rational or efficient so we only use this number as a secondary indicator and tool, after our fundamental and technical analysis is complete.

Once you determine the PEG ratio of the stock you are looking to buy, take the time to calculate the PEG ratio for the “sister stocks” in the industry group to see if they have higher or lower PEG ratios. Keep in mind, PEG ratios don’t work for companies with negative or non-existent earnings numbers.

Do you want to implement a PEG strategy into your fundamental arsenal; then think about this very basic example?

Let’s say we are looking at two stocks to purchase with these similar characteristics:
They are both trading near $20 per share.
Both stocks have a P/E ratio of 20 (they are trading at 20x’s their earnings)
The first stock grows earnings at a 10% annual rate
The second stock grows earnings at a 20% annual rate

Watch how the price will change in the future assuming that the P/E ratio remains unchanged:

012507_peg_example_sm.PNG

Stock ABC:
Starting Price: $20
Annual Earnings: 1.00
P/E: 20
PEG: 2.0

Stock XYZ:
Starting Price: $20
Annual Earnings: 1.00
P/E: 20
PEG: 1.0

Price in One Year:
Stock ABC: $22
Stock XYZ: $24

Potential Price in Three Years (based on Growth Ratios):
Stock ABC: $26.62
Stock XYZ: $34.56

* Using this very basic example, we can see that stock XYZ with the 1.0 PEG ratio should outperform the stock with the 2.0 PEG ratio due to the earnings growth rate. This is not guaranteed but can help when looking to make a purchase between two similar stocks.

Can you TRUST Talking Heads, I mean analysts?

I mention the phrase “Talking Heads” on this blog from time to time and I am serious. Most large investment houses get it wrong when it comes to timely stock selections (at least outside of their institutional research departments). When using the phrase “talking heads”, I am referring to analysts and firms on the retail side of the fence.

011707_enron.gif

I have preached that these firms are only looking out for their best interests, not yours. They don’t care about anything but your money; they never look out for the small investor (in my opinion of course)! I wrote a post on my old blog about the coverage of Enron and thought it would be great to update the entry and focus on the “Talking Heads”.

Look below to see how multiple major firms kept sending out buy signals for Enron based purely on fundamental analysis. If they looked at the charts, they would have noticed several breakdowns among every type of chart available (intraday, daily, weekly, monthly, etc…). It didn’t matter what chart you viewed, they all had red flags at every corner and even a novice could have located the correction coming. I am not saying that anyone saw the collapse but simple sell rules should have taken all technical investors out of the stock (I never owned Enron and I am glad).

011707_enron_chart.gif

I have included a condensed summary of the case study based from the Dorsey Wright analysis of the Enron collapse (all research was performed by Dorsey Wright – www.dorseywright.com)
I have no affiliation with Dorsey Wright:

View the entire breakdown through this PDF:
Anatomy of a Collapse – Enron

CBS Market Watch Also provides an excellent long term chart though this Timeline

ENE – Enron

Merrill Lynch:
March 21, 2001: $55.89 Reiterated Near-term “Buy” at Merrill
April 17, 2001: $60.00 Reiterated Near-Term “Buy” at Merrill
August 15, 2001: $40.25 Cut to Near-Term “Neutral” at Merrill
Oct 9, 2001: $33.39 Raised to Long-term “Buy” at Merrill Lynch
Oct 16, 2001: $32.84 Raised to Near-term “Accumulate” at Merrill Lynch
Nov 1, 2001: $11.99 Cut to Near-Term “Neutral” at Merrill
(finally cut after 79% loss – not cut to sell)

Banc of America:
August 15, 2001: $40.25 Reiterated “Strong Buy” at Banc of America
August 28, 2001: $38.16 Reiterated “Strong Buy” at Banc of America
Oct 25, 2001: $16.35 Cut to “Market Perform” at Banc of America
(finally cut after 59% loss – still market perform)

Commerzbank:
March 14, 2001: $62.75 Raised to “Accumulate” at Commerzbank
March 22, 2001: $55.02 Reiterated “Accumulate” at Commerzbank Capital
April 18, 2001: $61.62 Reiterated “Accumulate” at Commerzbank Capital
Nov 9, 2001: $ 8.63 Cut to “Hold” at Commerzbank
Nov 28, 2001: $ .61 Cut to “Sell” at Commerzbank Capital
(finally cut to “SELL” after 99% loss)

Lehman:
March 12, 2001: $61.27 Reiterated “Strong Buy” at Lehman
Oct 24, 2001: $16.41 Reiterated “Strong Buy” at Lehman; “the stock is attractively priced)
(still a strong buy after 73% loss)

**Click to Enlarge Point and Figure Chart of ENE**
012305_ene_pnf_sm.jpg

The Lesson: Use both Fundamental and Technical Analysis!
And always cut your losers, no matter what anybody says, especially the broker making money from your commissions!

Do Not use Fundamental Analysis Alone!

Most people reading this blog already know the differences between fundamental and technical analysis so I will not go into too much detail on each subject. However, new readers and novice investors may still be confused and that is completely understandable since many main stream analysts still focus on “the numbers” rather than the charts to determine their entry and exit decisions. Don’t get me wrong, I study the numbers and focus on investing in companies that actually turn a profit but the fundamentals don’t help me with my decisions of “when to buy” and “when to exit”. The foundation of my system is based on a CANSLIM philosophy that integrates fundamental and technical analysis. So please – take it easy value and buy-and-hold investors. We all know that there is no “ONE WAY” to invest successfully.

Click_to_Enlarge

To start, turn on any major network news station and you will become bombarded by fundamental analysis and strong opinions based on fundamental numbers and nothing else. It’s the strong opinions that bother me more so than the actual dissection of the company’s balance sheet. Occasionally I will see a basic line chart posted on the screen that highlights the recent history of prices but it is presented without any study or analysis from the “talking head”. In addition to not focusing on charts, these analysts tend to concentrate on the same mega stocks each and every day (the most famous blue chip stocks or stocks of the past as I like to call them). It disturbs me that the “buy and hold” strategy is still the predominate scenario discussed on the major news networks and newspapers across the nation. Yes, buy-and-hold still works for some investors but it has cost many more large profits in the market because they believe their portfolio is doing well because it is always compared to the averages.

They tell you on Wall Street that you had a great year if your portfolio only lost 10% because the DOW and S&P 500 lost 20%. You beat the averages – they will tell you. What a bunch of crap because the entire purpose of investing is to make a profit and grow your net worth. I am not doing this to lose money and pat myself on the back that I only lost half as much as the averages. I’ll leave that thinking for the bozo’s of the world.

Reading corporate financial statements is an excellent skill for every investor but making short term buy and sell decisions based from this information can be costly. In my opinion (yes, my opinion), a short term trade is less than one month but I focus on intermediate trades which can typically be held from a few weeks to several months based on the action in the stock.

010807_bozo.jpg

What most “average” bozos don’t realize is that a stock price usually breaks down well before the actual fundamentals turn negative and the official negative news hits the street. Reading about the Dow Theory could have given you this small piece of advice and that theory was written over 100 years ago. Insiders always start to sell when things are looking down or sales are not expanding. This poses a problem for the individual investor because they won’t know about poor sales or earnings until the official news is published or the company changes their outlook in a conference call, months after the problem has already developed. Look at the Home Building Industry for a perfect example. None of these companies reported losses until this year yet their stocks started to drop considerably, early last year. Toll Brothers (TOL) and KB Home (KBH) are used as examples in this post.

Click_to_Enlarge

You may now ask: How can I sell before the fundamentals turn negative?

It’s called technical analysis, a study of chart patterns that allow the investor to determine if a company may be heading in the wrong direction or sideways pattern after an extended up-trend. Fundamentals make you aware of a particular stock to purchase as sales and earnings are rising quarter over quarter and year over year but they don’t get you out of the stock before the floor drops. Just because a company has excellent earnings or a perfect track record, doesn’t mean you buy immediately. You may be buying after an extended up-trend while the stock is due for a correction before its next up-trend. Nobody knows how long a correction will last; it can be 8 weeks, 8 months or 18 months. Why would you park your money in an investment that is stagnant or can possibly lose money for an extended period of time even though the bottom line is pretty? This is a common buy and hold strategy that the analysts tout to novice investors.

Technical analysis can help investors spot red flags such as distribution days, breaking of support lines or the violation of key moving averages. Pure Fundamental investors will not sell or even be aware of the current situation on the charts leaving them vulnerable to costly drops in price that may take years to recuperate. The talking heads of the media may still recommend a particular stock with a high risk chart formation only because they don’t understand that all key fundamentals are priced into the stock six months in advance. The technical investor will see the trouble arising and can take action well before the “bad news” hits the street. The technical investor won’t know what this bad news will be but they know it won’t be positive and that is the most important fact.

When technical red flags are flashing in all directions; sell and wait to see how the stock is going to react and what news is on the horizon. Sooner, rather than later, negative news will come out from the company stating that sales have slowed, a contract was lost, a drug was not approved, or maybe the CEO is resigning. Whatever the negative news may be, as soon as it hits the headlines, fundamental analysts will be talking their heads off at how it may be time to sell (even though the stock is now many percentage points below the key sell signals flashed on the charts). The stock has usually dropped dramatically by this point but the numbers have not been updated until now, the time the whole free world can now sell for a significant loss. On the other hand, the buy and hold investor will usually just hold and claim that they broke even or made a profit several years in the future. Who cares if you make 25% or 50% over a 5 or 10 year period. Don’t allow a loss of 10% snowball into a 50% drop in your portfolio. Stocks such as Microsoft may take another 5 years or more just to break some investors even from 2000. That would make 10 years or more for the poor sole that bought in the bubble burst of 2000.

I use both fundamental and technical analysis to make decisions in the market and believe that both tools give you an advantage over the investor that only uses one of these tools. It’s just a matter of how, when and where each of these tools are used that can add to your overall success.

Listen to your System

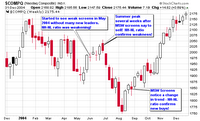
As I highlighted in the blog post yesterday, my system alerted me that the market was going to take a turn south in the summer of 2004 and it did (May, June and July). It is important for every trader to have your own system that alerts you of moves which allows you to profit. It can be short term, long term or anything in between but you must understand what it is saying. I depend on the price and volume of the major indexes, the NH-NL ratio and the action among the individual leaders to determine if the market is strong or weak. Since I have studied these patterns for years, I know when the market is moving higher or lower based on the confirmations each of these indicators give me. Nothing is exact but they are extremely accurate as they guide me with test buys, position sizing my trades and moving me to the sidelines.

Take a look at how these three major indicators got me in and out of the market in 2004 (and keep in mind that I am not a day trader – I was momentum trading, trend trading and swing trading in 2004 – which ever you would like to call it).

I wrote this entry on my Weekly Screens on April 19, 2004 (the highs on the NASDAQ in April 2004 were not revisited until November of that year):

Market Overview: The market is still in a confirmed rally according to rules but we are seeing many stocks hesitate and undecided about their direction. The world situation has been a big influence on the general market conditions. Speculation of an interest rate hike has kept the market in flux.

My screens showed bad news last week with the daily new highs and lows. For the first time since posting my screens in November (2003), the daily new highs were lower than the daily new lows. I haven’t seen action like this since the bear market.”

I posted a weekly screen insert in yesterday’s blog post from July 2004 which warned that the market was still heading lower. The MSW screens turned negative in May 2004 and stayed that way until late August 2004 as you will read below.

WEEKLY OVERVIEW of 8/16/04 to 8/20/04:

“…However, I am possibly seeing a new trend that may be starting to form in the indexes. You heard it here first. I may be early but I am seeing a change in my screens. (Please note, I saw the trend in March of 2003, especially April of 2003 – I posted in real time on this breakout simultaneous with IBD). I was tipped off by the “new highs vs. new lows” combined with the huge institutional sponsorship that was sending stocks to new highs.

The DOW was up just short of 3% from Friday (13th) to this past Friday (20th)
The NASDAQ was up 4.5% in the same time period
I have noted that volume was extremely weak.

The New Highs vs. New Lows picture looked different than past weeks.
We had 3 days out of 5 that had more new highs.

On 8/13, we had – NH-37, NL-304
On 8/20, we had – NH-128, NL-53

I know this is minor but it may be the first signs of a changing atmosphere. Stayed tuned as I will keep a close eye on this change in my screens. (I have done my daily analysis for Monday, August 23, and I see more encouraging signs in the NH vs. NL list: 131 vs. 46). Again, volume was weak. When the charts and volume cooperate with the new highs list, we may be half way to a new up-trending market.”

Looking at the chart from 2004, I guided traders out near the top of the early summer decline and I guided them back in at the beginning of the late summer/ fall advance.

More recently, I took investors out of the market in mid May 2006 and hope to have them back in when my screens confirm the rally in the future. When will that be? I don’t know but my research will tell me as it has every time in the past.

If you would like to review my work on the MSW screens, I invite you to explore my past archives from 2004 and 2005 as they are open to the public. You can review a chart as you read everything I have written over the past two years. The archives for 2006 are for members only but will open to the public when the year ends. Using my three main indicators, I have been very successful by getting in and out of the market since late 2002. Prior to 2002, my system was not as strict as it is today but I learned my lesson by getting slammed in 2001.

Develop a system, hone that system and understand what it is trying to tell you and you will come out with a profit. Every trade can’t be a winner but you won’t be fighting the trend because your overall system will tell you what side of the market to trade.

Piranha

Question about Earnings (GES)

MSW Member Question:

Hi Chris,

My name is Joe and I am a member of MSW. I have a question that I really don’t understand. I am currently holding Guess (GES) and today it has an earning CC saying earnings beat estimates by 0.08/share. However, the stock dropped 10% with 800% more volume than average. The same situation happens to LMS where it dropped 20% with great earnings. Is there something wrong with the report that I have to pay attention to? Thanks for the advice.
(Actual member’s name has been changed for privacy)

My answer:

Two things you need to understand:

  1. Current stock prices reflect actual or anticipated news and earnings from the past six months so the great earnings release today was already priced into the stock.
  2. Future expectations and earnings will be priced into the stock today after the release based on the projections. All future moves of this stock will be based on the expectations at the next earnings release (essentially, the stock price is foreshadowing the price six months from now).

In the case of your stock, Guess (GES), it crushed earnings:

Q4 EPS Increased 73% Versus Q4 Last Year, $0.57 Versus $0.33
2005 Net Earnings Doubled Over 2004, $58.8 Million Versus $29.6 Million

Fourth Quarter Highlights
– Net revenues increased 23.5% to $276.6 million
– Comparable store sales up 15.9%
– Gross margin increased 310 basis points to 42.6%
– Earnings from operations up $17.3 million to $43.4 million
– Net earnings increased 74% to $25.8 million

2005 Highlights
– Net revenues increased 28.4% to $936.1 million; comp store sales up 9.2%
– Gross margin increased 310 basis points to 40.7%
– Earnings from operations reached $101.8 million
– Net earnings doubled to $58.8 million

Sounds great, right? WRONG. These numbers have already been priced into the stock. The stock broke out about six months ago above $25 as shown on the chart above. That was the proper time to get into the stock as it was trading on future expectations. Stocks move ahead of the news and not on the announcement of the news unless it’s extremely positive or negative (or a complete surprise).

Thursday’s 13% drop represents future expectations of the company and not the earnings that were released yesterday (again- they have been priced into the stock over the past six months). Here is the culprit of the recent drop in price:

LOS ANGELES, Feb. 16 /PRNewswire-FirstCall
Guess? Inc. today reported record financial results for the fourth quarter and fiscal year ended December 31, 2005. Net revenue and net earnings for the quarter and the year were at their highest levels since the Company went public in 1996.

Guess Inc. shares declined Thursday after the jeans and fashion retailer warned of moderated first-quarter sales growth. Stock of the Los Angeles-based company fell $6.05, or 13 percent, to close at $40.15 in heavy trading on the New York Stock Exchange.

For the first quarter, Guess expects same-store sales, or sales at stores open a year or more, to rise 10 percent. The company expects overall sales to rise in the mid-teen percentage range, a slower rate of growth than in the last couple of quarters.

Wall Street had expected revenue of about $249.6 million, about 16 percent higher than revenue of $215.6 million in the prior first quarter.

On a conference call, Chief Operating Officer Carlos Alberini noted the snowstorms in the Northeast and the occurrence of Easter in April in 2006, rather than in March a year earlier, would hurt comparisons.

For the month of March, for example, Alberini expects same-store sales to be “nearly flat,” according to a transcript provided by Thomson StreetEvents. For the second quarter, the company expects same-store sales growth of 10 percent.

******************
As you can see, the current price drop reflects future growth and expectations and they seem to be flat so investors grabbed their profits and ran. The stock did manage to close above the 50 day moving average and it will be interesting to see if it holds support above this line (it has since the breakout above $25). The minute investors heard that the stock will not meet analysts expectations, they sold and ignored the great news from last year because they know that those profits have already been made.

An old Wall Street saying goes like this:
“Trade the rumors and sell the news”

Six months ago, the rumor was that this company was going to beat earnings expectations so investors started to buy. Now the rumor states that they won’t beat expectations, so they sold the news!

Piranha