Do Not use Fundamental Analysis Alone!

Most people reading this blog already know the differences between fundamental and technical analysis so I will not go into too much detail on each subject. However, new readers and novice investors may still be confused and that is completely understandable since many main stream analysts still focus on “the numbers” rather than the charts to determine their entry and exit decisions. Don’t get me wrong, I study the numbers and focus on investing in companies that actually turn a profit but the fundamentals don’t help me with my decisions of “when to buy” and “when to exit”. The foundation of my system is based on a CANSLIM philosophy that integrates fundamental and technical analysis. So please – take it easy value and buy-and-hold investors. We all know that there is no “ONE WAY” to invest successfully.

Click_to_Enlarge

To start, turn on any major network news station and you will become bombarded by fundamental analysis and strong opinions based on fundamental numbers and nothing else. It’s the strong opinions that bother me more so than the actual dissection of the company’s balance sheet. Occasionally I will see a basic line chart posted on the screen that highlights the recent history of prices but it is presented without any study or analysis from the “talking head”. In addition to not focusing on charts, these analysts tend to concentrate on the same mega stocks each and every day (the most famous blue chip stocks or stocks of the past as I like to call them). It disturbs me that the “buy and hold” strategy is still the predominate scenario discussed on the major news networks and newspapers across the nation. Yes, buy-and-hold still works for some investors but it has cost many more large profits in the market because they believe their portfolio is doing well because it is always compared to the averages.

They tell you on Wall Street that you had a great year if your portfolio only lost 10% because the DOW and S&P 500 lost 20%. You beat the averages – they will tell you. What a bunch of crap because the entire purpose of investing is to make a profit and grow your net worth. I am not doing this to lose money and pat myself on the back that I only lost half as much as the averages. I’ll leave that thinking for the bozo’s of the world.

Reading corporate financial statements is an excellent skill for every investor but making short term buy and sell decisions based from this information can be costly. In my opinion (yes, my opinion), a short term trade is less than one month but I focus on intermediate trades which can typically be held from a few weeks to several months based on the action in the stock.

010807_bozo.jpg

What most “average” bozos don’t realize is that a stock price usually breaks down well before the actual fundamentals turn negative and the official negative news hits the street. Reading about the Dow Theory could have given you this small piece of advice and that theory was written over 100 years ago. Insiders always start to sell when things are looking down or sales are not expanding. This poses a problem for the individual investor because they won’t know about poor sales or earnings until the official news is published or the company changes their outlook in a conference call, months after the problem has already developed. Look at the Home Building Industry for a perfect example. None of these companies reported losses until this year yet their stocks started to drop considerably, early last year. Toll Brothers (TOL) and KB Home (KBH) are used as examples in this post.

Click_to_Enlarge

You may now ask: How can I sell before the fundamentals turn negative?

It’s called technical analysis, a study of chart patterns that allow the investor to determine if a company may be heading in the wrong direction or sideways pattern after an extended up-trend. Fundamentals make you aware of a particular stock to purchase as sales and earnings are rising quarter over quarter and year over year but they don’t get you out of the stock before the floor drops. Just because a company has excellent earnings or a perfect track record, doesn’t mean you buy immediately. You may be buying after an extended up-trend while the stock is due for a correction before its next up-trend. Nobody knows how long a correction will last; it can be 8 weeks, 8 months or 18 months. Why would you park your money in an investment that is stagnant or can possibly lose money for an extended period of time even though the bottom line is pretty? This is a common buy and hold strategy that the analysts tout to novice investors.

Technical analysis can help investors spot red flags such as distribution days, breaking of support lines or the violation of key moving averages. Pure Fundamental investors will not sell or even be aware of the current situation on the charts leaving them vulnerable to costly drops in price that may take years to recuperate. The talking heads of the media may still recommend a particular stock with a high risk chart formation only because they don’t understand that all key fundamentals are priced into the stock six months in advance. The technical investor will see the trouble arising and can take action well before the “bad news” hits the street. The technical investor won’t know what this bad news will be but they know it won’t be positive and that is the most important fact.

When technical red flags are flashing in all directions; sell and wait to see how the stock is going to react and what news is on the horizon. Sooner, rather than later, negative news will come out from the company stating that sales have slowed, a contract was lost, a drug was not approved, or maybe the CEO is resigning. Whatever the negative news may be, as soon as it hits the headlines, fundamental analysts will be talking their heads off at how it may be time to sell (even though the stock is now many percentage points below the key sell signals flashed on the charts). The stock has usually dropped dramatically by this point but the numbers have not been updated until now, the time the whole free world can now sell for a significant loss. On the other hand, the buy and hold investor will usually just hold and claim that they broke even or made a profit several years in the future. Who cares if you make 25% or 50% over a 5 or 10 year period. Don’t allow a loss of 10% snowball into a 50% drop in your portfolio. Stocks such as Microsoft may take another 5 years or more just to break some investors even from 2000. That would make 10 years or more for the poor sole that bought in the bubble burst of 2000.

I use both fundamental and technical analysis to make decisions in the market and believe that both tools give you an advantage over the investor that only uses one of these tools. It’s just a matter of how, when and where each of these tools are used that can add to your overall success.

Don’t shy away from High Priced Stocks

Why do investors buy low priced stocks, thinking they can double quicker than a stock priced over $100?

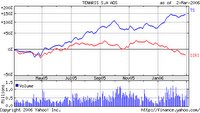
Over the past three months, Tenaris (TS) has gained 46% even though it is priced over the triple digit threshold. It is up almost 200% in one year! Too many times I see investors shy away from solid investments due to the high price level and/or the large prior advance. I have added strong stocks to the MSW Index time and time again that are priced relatively high when compared to most stocks but not high when compared to what the market believes they are worth: (i.e.: AAPL, HANS, TS, WFMI, GOOG). CME may have looked high at $100, $200, $300 and then again at $400 but it continues to move higher. Learn to forget about actual price and start to focus on actual percentage gains.

Realize that 46% is the same whether a $123 stock increases to $179 or a $5 stock jumps to $7.30. By the way, take Sirius as an example, it has actually moved from $7.12 on December 2, 2005 to $5.08 today. Doing a quick newspaper search, you will see many analysts and talking heads hyping that stock prior to Howard Stern leaving the air. What happened? People were trying to buy speculation, not fundamentals and technicals. TS is up 46% since 12/2/05 while SIRI is down almost 30%.

Don’t buy into the idea that lower priced stocks move faster and can provide quicker routes to riches – THAT IS FALSE! They will most likely provide quicker routes to ruin! In the past week, I have actually heard someone say that they were buying more shares if SIRI broke below $5 and couldn’t wait to do so! Good money after bad has never made anyone a profit. Good Luck, I am happy with my money in BOT (even if it doesn’t work out because my sell rules will protect me from dropping 30% in my position).

***Look at the chart comparison of a stock we recommended at $65 one year ago today and one that was priced near $6 per share with a TON of speculation! The high priced $65 stock is now trading above $180 in a strong up-trend and the low priced stock is now trading at $5 in a down-trend.

Here is a link to an article by another trader I respect: He talks about the reason why traders could afford Google last year (note: I started to cover the stock at $172 and cut it at $281 – I wasn’t in at the bottom or out at the top but I made a profit).

*Note that the article is from 2005 (not present day)
Yes, You can Afford Google

Piranha

Determine a Stock’s Price target

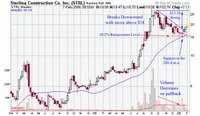
On Saturday, I added Sterling Construction Company (STRL) to the MSW Index as a non-traditional play. Why is it non-traditional for MSW? Because it was not breaking into new high territory as we screened it onto the Index. I said:

“This is not a typical MSW Index play but I see up-side potential on the chart after the correction in the $20 range and the support at the moving average. The down-trend was also broken as I will show you on the MSW Index charts. Rating: Buy (target is $30 in 2006)”

After giving a target price, I was questioned by a member as to how I came up with $30. I don’t teach how to develop price targets because there are many methods and none of them are extremely accurate and some vary greatly with their predictions. I don’t want to give false hope with a price target and I definitely don’t want to get sued by a member that believes a stock is going to reach a certain point based on my analysis. I run an equity research and education site, not an analyst firm so I am more concerned with finding stocks with the potential to move higher based on fundamental and technical analysis and not price targets (or upgrades and downgrades).

The stock entered the MSW Index at $18.93 on 2/4/06 with support at the 200-d m.a. I will show you two methods I use to develop price targets and then tell you why I picked $30 as a possible target based on the information provided by the two methods.

The first method to determine if the stock had bottomed is the use of the Fibonacci retracement levels (in this case, the 38.2% retracement which equals $15.46). It turns out that this retracement level also corresponds with the 200-d m.a. support and lifted the stock higher. Turning to the retracement level on the positive side, the method predicts a top at three common locations:
61.8%: $23.26
50.0%: $21.13
38.2%: $20.13

I also use another method that I first learned about in Stan Weinstein’s book “Secrets for Profiting in Bull and Bear Markets” called the swing method. This method takes the peak number ($28.35) and subtracts the bottom number ($15.05) to give us a swing number of $13.30. This was the size of the correction of the swing from $28.35 to the bottom at $15.05. Weinstein states that you take the swing number ($13.30) and add it to the peak number ($28.35) to give you a price target of $41.65. You can read more about this in chapter 6 of the book.

I now have two price targets that are completely different:
Fibonacci 61.8% retracement of $23.26
Weinstein swing method of $41.65

My target of $30 was developed by looking at the pattern and determining that the stock will most likely top near $30 if the former 52-week high is surpassed. The Weinstein method is accurate with CANSLIM type stocks and the Fibonacci method is very accurate when determining a pullback area.

Bottom line: everything is just a guess based on a certain set of parameters and information. No one truly knows where it will go. Place the position, set a sell stop slightly below the moving average and see what happens. If the stock gains more than 25% in the first few weeks, place a trailing stop to protect profits. Follow the rules and you will make money on winning trades and lose small amounts on losing trades. In the end, it should work out in your favor if you place several trades throughout the year. Several winning trades and several losing trades but the winners should be larger than the losers, keeping your portfolio in the black!

Piranha

What is a Stock Consolidation?

MSW Member Question:
Hi Chris,

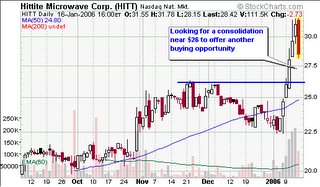
I look forward to checking out your website every day and thank you for all the valuable information that you provide. Please let me know what your definition of consolidation is. For example on 1/12/06 you mentioned this about HITT: “This is one to watch and grab at the first consolidation”. What is consolidation….how long does it last? Please explain.

Thank you!

My Answer:
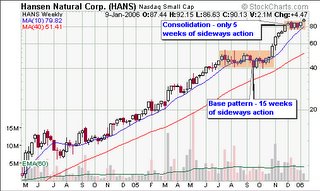
My definition of a consolidation may be different than other traders but I will explain what I am talking about when I use the term. When I say a stock is consolidating, I am referring to a sideways movement or a pattern that is forming some type of base that allows the stock to correct back down to a moving average or support area after a previous up-trend. Hansen Natural consolidated sideways below $90 before the big push last week to complete the $60-$100 run. The pattern was not long enough in time (minimum of 7 weeks) to be considered a flat base so we call it a consolidation. As you can see on the chart below, the first pattern highlighted last for 15 weeks – a true base. The next area highlighted only lasted for 5 weeks, a consolidation in the bigger picture that allowed current stock holders to add additional shares.

Most consolidation areas will have a support level and a resistance level with a breakout on a move above the resistance and a breakdown on a move below the support.

In the case of (HITT), my analysis is looking for a pullback or consolidation towards the support area (the most recent breakout area). As you know, HITT is not on the MSW Index but may offer upside potential if you enter closer to the consolidation area.

Piranha

What happens to “buy and hold” stock investors?

…I have always argued that you must cut your losing positions because they may take years to come back if they ever break even. Back in the 1930’s, RCA was the top touted stock but it took 30 years to break even from the 1932 price level. Ever hear of Enron, Worldcom, Lucent, etc… Two of these will never return a break-even investment for their holders and one may take another 5, 10, 15 or 20 years to break even (if ever). Lucent traded above $60 in late 1999 but has since traded in the $2 range. I know of a family member that went crazy buying up shares in 2002 and 2003 while it traded between $1.50 and $2.50. I know she still owns these shares to date and I told her not to do it and even sent her a free trial subscription to IBD in 2002. The stock closed at $2.77 yesterday. I know she is showing a profit but I also know she has locked up large sums of money in a dead stock that she is “hoping” will come back. She lectures me that I am a risky investor but I laugh to myself because LU may never make a watch list of mine ever again. I know she won’t read this so this is why I write about the topic.

Last night, two familiar stocks crossed my daily screens that were flying high in the late 1990’s and early 2000’s. The first stock, NVDA, was one that I owned many years ago as I was learning about video cards, photoshop and other large software programs that required cards from this company.

I was working with an architectural firm in Connecticut when I had a discussion with the principal owner about a company named Nvidia. This architect traded in the market seriously but on a casual basis in my opinion. While reading a magazine, he saw a story on Nvidia and how they were stealing market share from ATI and the other leaders at the time. Their technology was by far the best on the market and they were extremely innovative compared to the industry leaders. Based on that article and the fact that his firm just purchased computers with these chips, he immediately bought several hundred shares.

As I remember back, he loved high tech companies as did everyone and bought shares of Intel (INTC) and Cisco (CSCO) for each of his nieces and nephews on their birthdays. He would always say that they would thank him when they turned 18 and needed money for college. His quote was something like this: “If I give them $100 now, they will blow it in one shot at the mall; if I buy them shares, they may hate the gift now but will understand when college tuition is knocking on the door” and then he would say: “Intel & CSCO will never go down”. – Big mistake! This was the “buy and hold” mentality, even during the crazy 1990’s. Looking at a 5-year chart for Intel, the stock has not recovered the highs of 2001 and sits at a loss for shares purchased five years ago. Cisco is no where near its former highs of $70, $80 and $90 (it closed at $18.35 yesterday). I hate to say this but those nieces and nephews are showing losses (from the original installments of $100) that become ever bigger when you consider depreciation of the dollar and some inflation. The buying power of the $100 from 5 years ago is not the same today. If he bought them a mutual fund or invested into their education IRA’s, they may have made some nice profits.

Looking at his other stock, NVDA, he made a lot of money buying and selling because he felt NVDA was a fad, different from Intel. I don’t know if he ever sold his entire stake but if he didn’t, he would only be breaking even this week from shares purchased in May of 2002. Shares bought in early 2002 would still be showing a loss, four years later. I can’t imagine locking up my money for four whole years while a stock is sitting there doing absolutely NOTHING. On top of the stock doing nothing, he would have missed the education stocks of 2002, the builders stocks of 2002, 2003, 2004 and the final leg in 2005. He would have missed CECO, COCO, HOV, TOL, NVR, CTX, LEN, APOL, TZOO, TASR, FORD, URBN, APPL, RIMM etc. as the list goes on. No one person owned every one of these superstar stocks but the chance that he may have bought one or two of these market leaders exists.

The other stock making the screen last night (also a former MSW Index stock in late 2005) was NDS Group (NNDS). The stock closed at its highest level since June of 2001. To make an all-time high and allow some investors to break even if they are still holding from 2000, it would require the stock to gain $30 from the current $44 level.

I only provided a few short examples but you get the idea of the article. Don’t ever think for one minute that today’s leaders will be tomorrow’s leaders and that buying and holding is the ultimate answer. Turn to mutual funds if you prefer the buy and hold strategy. At least these fund managers will sell their poor performing issues and give you a “chance” by adding current day leaders.

The moral of the story: have sell rules and never hold a losing position!

Piranha