US Dollar Snapshot

Long Term Strategy on how to trade the US Dollar (it’s too simple for words):

Click here to open the US Dollar chart to a larger view (with more detail) of how accurate the 10-week/ 30-week moving average crossover signal (up or down) has been this decade.

121707_usd_wkly.png

Below is a chart of crude oil (the 10-week/ 30-week moving average crossover works just as well here):

121707_wtic_wkly.png

Leading Oil Stocks Diverge from Crude

As crude rises, a majority of the market’s oil leading stocks are heading in the opposite direction. This is interesting and I really started to take a deeper look this weekend after Howard mentioned this on his “Time to Golf” post:

“Oil stocks are being murdered, despite robust per barrel prices. This tells me, someone wants to raise cash–in a very big way.”

073007_crude_daily.png

073007_crude_wkly.png

I have owned and followed Petrochina on this blog throughout 2007 and can’t ignore the quick 10% correction it has made over the past couple of weeks.

073007_ptr_daily.png

All of the leading stocks listed below are making the same type of pattern correction as the price of crude continues to increase. It’s very interesting and I agree with Howard that someone big is selling into the strength. Other than that possible observation, I really don’t have much more to say on the subject so I will let the charts do the talking.

073007_brg_daily.png

073007_cvx_daily.png

[Read more…]

NASDAQ and Crude Oil Combo Index

I am revisiting a combo index chart that I highlighted numerous times last summer as the NASDAQ started a new leg up since the bull market in 2003. I described the chart as such in a post titled Can the NASDAQ – Crude Oil Index predict Bulls & Bears in June of 2006:

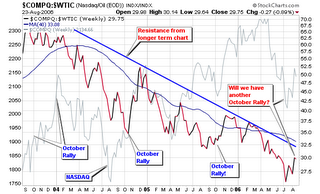
The chart is a combination index that I created using Stockcharts.com advanced tools. It combines the average close of both the NASDAQ and crude oil contracts over the past 10 years with a 200-d moving average. As you can see, the progression of this chart has called every major up-trend and downtrend before it was about to happen. The gray line on the chart represents the actual close of the NASDAQ index over the past 10 years (this line varies from the combo index).

062707_nas_crude_yrly.png

Viewing the current progression of the chart, we can see that the combo index is violating the 200-day moving average for the first time since last summer (August 2006) when the NASDAQ was trading about 20% lower than current levels. Looking back, the NASDAQ has always corrected, even slightly when the combo index crosses back below the 200-d moving average. Please see all red highlighted circle areas on the yearly chart. Our best idea of what may happen can come from the action back in late 2003 and early 2004. The NASDAQ made a multi-month consolidation before trending higher again.

The NASDAQ has gained more than 100% since the low in late 2002 and this is the first time since the bubble burst that the combo index is trading above the long term trendline (dotted black line) so things may be different this time around.

No one knows what will happen but I will remain cautious since this secondary indicator has been fairly accurate over the past ten years. Couple that with the fact that the NASDAQ is trading about 30% higher than it was last year at this time and the fact that crude oil is trending higher in a yearly cup shaped base. Many indicators scream correction but the market keeps trending higher. Price and volume will remain the primary indicator!

062707_nas_crude.png

This post, Will the NASDAQ be 50% higher in 6-12 months? details some more information about the mysterious combo index that I follow as a secondary indicator:

…The combo index highlighted the relationship of the two indexes and actually told us on a higher level when and where the market was making rallies or starting major down trends over the past 10 years.

062707_crude.png

I asked this question on August 23, 2006:
Will the NASDAQ be 50% higher in six to twelve month from this year’s bottom?

Well, it didn’t gain 50% but it did manage to tack on 30% – NOT TO SHABBY!

062707_nas.png

Crude Oil Opportunity?

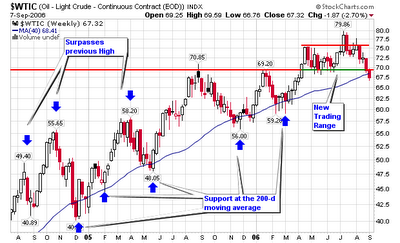
Oil has recovered every time at the 200-d m.a. Is this a buying opportunity?

We see five opportunities in the past two years at this long term moving average.

Take the trade (buy options if you want leverage or use futures contracts). What ever you do, sell a small loss and move on if it doesn’t work. Investing is that simple.

Taking trades with a favorable risk to reward ratio. It seems to me that a long position would be ideal even if I am wrong because the reward could take us back towards $80. I am looking at a 2-3 point loss for a possible 10 point gain (minimum 3-to-1 odds with a possible 5-to-1 pay out).

Cut all losses short if the trade fails! (In December 04, crude cut the 200-d m.a. sharply only to recover).

It’s not about being right or wrong; it’s about being able to push the odds in your favor, take the trade and follow the rules. If it doesn’t work – OH WELL! Move on!

Piranha

Will the NASDAQ be 50% higher in 6-12 months?

I posted up a chart looking at the relationship between the NASDAQ and crude oil contracts a couple months back in an entry titled “Can the NASDAQ – Crude Oil Index predict Bulls & Bears”.

The combo index highlighted the relationship of the two indexes and actually told us on a higher level when and where the market was making rallies or starting major down trends over the past 10 years. Visit the link above for a further description of the actual combo index.

As this year moves on, I have noticed that the combo index continues to reach new multi-year lows while traveling below its 200-d moving average. Recently, it started to move north but still lives beneath the moving average and long term trend-line or resistance. I am still wondering if this index is useful and if it can confirm a sustainable rally if it crosses back above the 200-d m.a. and multi-year resistance line.

While reviewing the three year chart, I noticed the spikes in October and was wondering if it will do the same this year since the action is starting to resemble previous years (post bubble burst era). Whatever the case, it will be very interesting to see many indicators move to the positive side simultaneously all confirming a possible rally towards the end of this year. The Stock Trader’s almanac states that mid-term election year lows usually peak 50% higher in the following 6-12 months. We are now in a mid-term election year and several indicators look to be hitting bottoms with an urge to move higher.

So I ask:
Will the NASDAQ be 50% higher in six to twelve month from this year’s bottom?

Only time will tell and I will not know the answer until my most important indicators give me the green light signal to buy heavy on the long side!

Piranha