Home Builders Update

The builder’s index was up more than 10% this week (July 20-24, 2009), one of the leading groups in the market. The industry is still badly beaten and I do not own shares in any of the companies listed and I don’t plan to buy any time soon. Like I said two years ago in the blog post The Best Home Builder Stock

“The bottom may be near but the upswing could take years if you go back and research history. Badly beaten down industries can take anywhere from two to five years to rebound and start trading higher.”

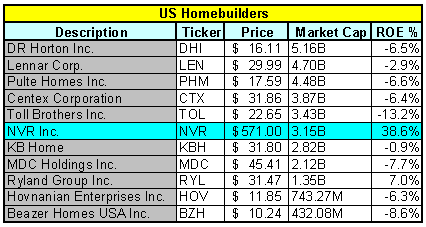
Give it time, past industries can and usually do take years to recover. The one “prediction” I did make has held true, NVR continues to be the group’s leader. Since my blog post on 8/24/07, NVR is the ONLY stock showing a gain with Hovnanian still down more than 75%. Toll Brothers is a distant second with a 10.77% loss.

072509_nvr_monthly_01

(NVR) NVR Inc.: + 7.74%
(TOL) Toll Brothers Inc.: -10.77%
(MDC) MDC Holdings Inc.: -19.99%
(DHI) DR Horton Inc.: -22.76%
(RYL) Ryland Group Inc.: -30.15%
(PHM) Pulte Homes Inc.: -40.29%
(KBH) KB Home: -43.33%
(LEN) Lennar Corp.: -58.49%
(CTX) Centex Corporation: -67.11%
(BZH) Beazer Homes USA Inc.: -75.27%
(HOV) Hovnanian Enterprises Inc.: -75.99%

I guess it helped to work in this industry during the boom for approximately five years but I am sill surprised that some of the big guys haven’t merged or taken over their competitors.

Other than Housing, Biotech and Cyclicals also lead the market this past week (+26% & +10% respectively), these are not the groups of choice for leaders (in my opinion).

072509_nvr_monthly_02

Here’s the original post from August 24, 2007:

The analysis below will show you why I select this stock as the best bet when the builders eventually hit a bottom and start moving higher.

Nathan Rothschild, founder of one of Europe’s most-powerful economic dynasties, uttered one of the most frequently quoted maxims on investment timing in the early 19th Century when he said, “The best time to buy is when blood is running in the streets.”

Now, blood is running in the streets for this industry and the homebuilders are getting their rear-ends kicked by Wall Street, the media and anyone else that will jump on the bandwagon.

082407_list_builders.png

So, when will the bottom arrive? Who the hell knows? And if someone tells you they know, just walk away because they are fooling themselves and anyone who listens.

The bottom may be near but the upswing could take years if you go back and research history. Badly beaten down industries can take anywhere from two to five years to rebound and start trading higher.

With that said, I would like to tell you why I feel that NVR Homes (NVR) is the best bet when the bottom does arrive and we start to see some life in this area.

[Read more…]

Trading DXO on Twitter

I have blogged and twittered about DXO for almost eight months now and nailed both the entry and exit points of the trade. I really nailed the exit (lock in gains) for the twitter community even though I sold earlier. I tweeted the day before and the day after the ETN topped and told everyone that it was a good idea to lock in gains “here”. Take a look back at the tweets and view the chart where I was making calls on DXO. See, twitter is valuable when people use it correctly.

7/11/09: DXO – $3.48, down more than 26% from sell calls. DXO gained more than 74% from my first twitter buy calls

Who says charts don’t work?

071109_dxo_daily

  • 7/6/09: $DXO – 3.90, down 18% since my sell tweets in June. 6/10 @ 4.67 & 6/12 @ $4.76. Always ignore analysts, never ignore charts! 10:04 AM Jul 6th from web
  • 7/6/09: RT 6/12/09 @cperruna $DXO – $4.76, “talking heads” now debating $250 oil prices…charts are saying resistance in this area. Lock in gains. 8:29 AM Jul 6th from web
  • 6/12/09: $DXO – $4.76, “talking heads” now debating $250 oil prices but the charts are saying resistance in this area. Lock in gains. 6:38 AM Jun 12th from StockTwits
  • 6/10/09: $DXO – $4.67, up 72% from 4/20 $2.72 twitter coverage. Lock in gains here, resistance above at 200d ma 11:18 PM Jun 10th from StockTwits
  • 5/29/09: $DXO – $4.21, talk about blast off above $3.75 breakout. Made nice profit but sold too soon, ignoring my own chart analysis. Entry is gone 12:00 PM May 29th from StockTwits
  • 5/29/09: $DXO – $4.03, it blasted past the $3.75 triple top breakout point, highlighted in this blog post, see P&F chart http://bit.ly/wTjX 9:07 AM May 29th from StockTwits
  • 5/26/09: $DXO – $3.79, cashing in profits. See April twits on DXO, buy at $2.72. 11:00 PM May 26th from StockTwits
  • 4/20/09: $DXO – $2.72, the gap has filled, down 10% on heavy volume in early trade. 50d ma is at $2.62 (support entry?). 9:38 AM Apr 20th from StockTwits
  • 4/6/09: $DXO – I am looking for the gap to fill down near $2.70; will grab short term shares between $2.50 – $2.70. Moving ave support at $2.55 8:26 PM Apr 6th from StockTwits
  • 3/30/09: $DXO is dropping back to the moving average – watch it for setup 8:59 PM Mar 30th from StockTwits

2/09/09 Blog Post:

Play with fire and you get burned – that’s what they say. I guess it doesn’t appear to be smart to leverage yourself (2x’s) with crude oil futures through an ETN but that’s precisely what I started to do in December. My tool of choice: DXO Oil Double Long ETN

It’s still the trade that intrigues me the most…

I grabbed shares that represented 25% of my typical position size so my risk is greatly limited but I am looking to add shares, only this time with an official buy signal…the current charts are showing that potential with a jump above the moving average or a breakout on the point and figure chart.

A strong move above $3.75 on the point and figure chart will be a major buy signal, especially if it is accompanied with heavy volume.

I’ll be honest; it might be too early (still) as the chart could drag along the bottom of the moving average for months before it decides to pick a direction. However, when it does, I’ll be ready to pounce and add shares to my first position.

Let’s wait and see but don’t let this one off of you watch list.

New High New Low Data

I am once again focusing my energy on the New High New Low (NH/NL) data as it is historically the most accurate indicator in the market. No indicator is as valuable as this tool. What I have done today is charted the 10-d/30-d MA Diff to show you a major crossover that occurred in March 2009. The exact date of the crossover was March 18, 2009; the NASDAQ is actually up more than 26% since that day. Not a bad trading strategy but I will admit it’s not one that comes around often. The second and third charts show the NH/NL differential and the NH/NL 10-d ma diff.

As I said in the post NH NL Picks Market Tops and Bottoms:

Consistent Nasdaq readings above 100-200+ will be the official confirmation to grab and add shares for trend traders!

That’s what I am looking for! Until that happens, a “true” up-trend is not sustainable. The up and down whipsawing of the past several month is what we can continue to expect until we see consistent readings in the triple digits.

062909_nh_nl_1030diff

062909_nh_nl_diff

062909_nh_nl_10ddiff

Summer Reading 2009

Learning about Stocks (Fundamental and Technical Principles):

System Development and Market Psychology:

Great All-around Reads:

All Others:

My Twitter Positions are Up Big

I have been using Twitter and StockTwits for approximately two months and have highlighted 18 different stocks. Of the 18 stocks, 15 are currently showing a gain and 3 are showing a loss for an average gain of 20% per position. I only analyze stocks that I am about to buy/sell or would possibly buy/sell. I don’t talk about any old stock for the sake of posting tweets and wasting people’s time.

The average gain of the stocks showing a profit is 26%.
The average loss of the stocks showing a loss is 11% (-5%, -8% and -21%).

The top performing position is DXO, currently up 65% with a peak gain above 70%. Following DXO is EJ at 56%, STAR at 50%, RVBD at 40%, FRPT at 32%, ARST at 26% and V & VMW tied at 25%.

Visa (V) has appeared the most with a total of eight mentions (I may be biased since it’s my largest personal holding). DXO has also been an active play of mine since 2008 so it has been the second most popular ticker in my tweets, appearing five times over the past two months (DXO first appeared on this blog last November as a speculative oil play).

I would like to emphasize that the stock down 21% (APEI) would have been cut for a smaller loss using simple money management tools but for purposes of this update, we’ll assume everything is still being held.

Below is the list of stocks highlighted on my Twitter account, listed in date order (starting on March 31, 2009):

  • HTS: +7%, $26.15 from $24.35 on 3/31/09
  • V: +25%, $69.28 from $55.60 on 3/31/09
  • VMW: +25%, 32.59 from $26.12 on 4/1/09
  • RVBD: +40%, $21.52 from $15.37 on 4/2/09
  • STAR: +50%, $22.45 from $15.00 on 4/5/09
  • CXO: +14%, $31.90 from $27.96 on 4/5/09
  • DXO: +65%, $4.48 from $2.72 on 4/20/09 (1st posted on 4/6/09 at $3.07)
  • EJ: +56%, $16.78 from $10.79 on 4/9/08
  • ARST: +26%, $18.19 from $14.46 on 4/9/09
  • FRPT: +32%, $9.36 from $7.09 on 4/13/09
  • WMZ: +12%, $19.85 from $17.70 on 4/14/09
  • CTCT: +10%, $20.14 from $18.36 on 4/20/09
  • TNDM: +15%, $30.78 from $26.81 on 4/20/09
  • CFL: +11%, $30.60 from $27.50 on 4/26/09
  • PAR: +3%, $11.27 from $10.94 on 6/2/09
  • APEI: -21%, $34.56 from $44.00 on 4/2/09
  • MDAS: -5%, $15.90 from $16.79 on 4/23/09
  • MELI: -8%, $23.62 from $25.60 on 5/12/09

If you haven’t joined already, take the few seconds to follow me on Twitter as the bulk of my analysis appears there weekly, if not nightly.

P.S. – the bragging title of this post probably signals a short term top in the market! As I wrote yesterday:

“The main purpose of the stock market is to make fools of as many men as possible.” – Bernard Baruch

060609_dxo_daily

060609_v_daily

060609_ej_daily

[Read more…]