Are these stocks headed for more trouble? If so, are they setting up ideal short opportunities? Are they past their ideal shorting opportunity? Take a look for yourself.
I was running a basic screen this morning looking for stocks above $15 per share that were violating their 200-day moving average on above average volume. The daily volume must be at least 50% larger than the average over the past 50 days. The current price must be within 5% above the 200-day moving average or 15% below the 200-day moving average.
Top Ten Price Declines (Monday morning trading):
- (NVR) N V R Inc
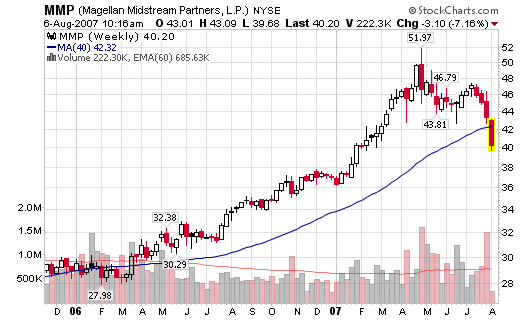
- (MMP) Magellan Midstream Ptnrs
- (WPZ) Williams Partners Lp
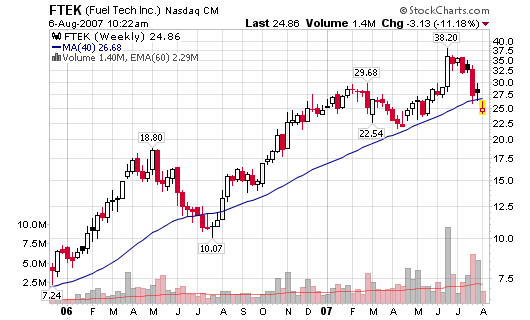
- (FTEK) Fuel Tech Inc
- (PAA) Plains All Amer Pipe
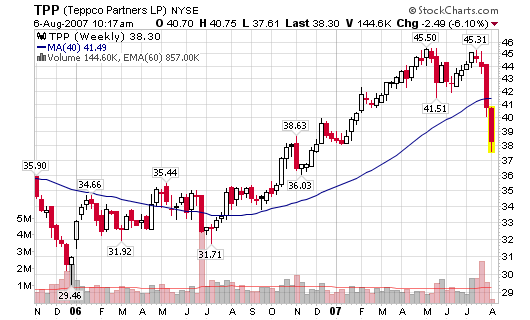
- (TPP) Teppco Partners Lp
- (BPT) B P Prudhoe Bay Rylty Tr
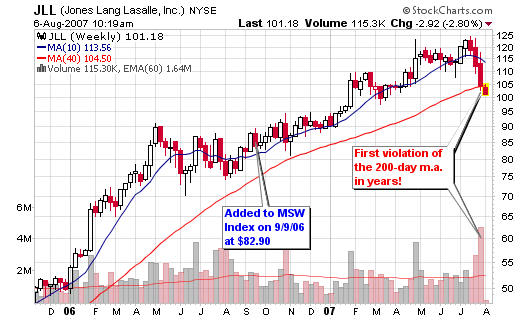
- (JLL) Jones Lang Lasalle Inc
- (KMP) Kinder Morgan Energy Lp
- (GSF) Globalsantafe Corp
Top Ten Decliners on Largest Volume (Monday morning trading):
- (FTEK) Fuel Tech Inc
- (NRGY) Inergy L P
- (MMP) Magellan Midstream Ptnrs
- (IJJ) Ishares S&P Mdcp 400 Vl
- (BTE) Baytex Energy Trust
- (BPL) Buckeye Partners L P
- (XOP) Spdr S&P O&G Expl
- (EPD) Enterprise Products Ptnr
- (TPP) Teppco Partners Lp
- (PGH) Pengrowth Energy Tr Unit
The most interesting stock on the list for me is JLL as it has been a market leader for years. The beginning of the end of all great bull runs can be pinpointed to the collapse of many of the great leaders during that period. I have watching many of the top stock leaders of the past year starting to reverse their fortunes and correct back down towards their 200-day moving averages and in some cases, violate the line for the first time several years. Is this a correction or the end? I don’t know but I’ll trade the setups!
Interesting times!


Interesting rally the market had yesterday – but it makes me think of something Elder says in Trading for a Living, he says that “Mondays are typically the best day in a bear market.”
I’m interested to see what happens over the rest of the week.
Kris,
You are correct and I don’t buy into the hype yesterday as my latest post explains.
Hi Chris, I,ve been reading your blog for a month now. Any who, There are two things I don’t understand. 1. In the stock chart JLL you refer to the violation of the 200 MA, but when I look at the top left of the chart I see your plotting a 10 MA & 40 MA. 2. I see you refer to the 50 day MA a lot so why are you using the 40 ma?
Thanx, Tom