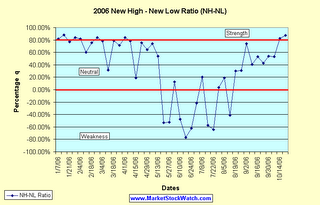
The NH-NL ratio surpassed its strongest weekly level since May 6, 2006 when it closed at 503-74. This was the tenth consecutive positive weekly ratio with new highs closing at 442 and new lows dropping below 30 for the first time in 2006. The weekly lows averaged 29 per day which gives us the lowest reading since the week ending July 30, 2005 when the market averaged exactly 28 new lows per day. The NH-NL ratio chart shows that last week gave us the highest reading (87.69%) since the week ending January 14, 2006 (87.97%). The past two weeks have spent time above the positive 80% calculation that I have explained on past blog entries (links below). The NH-NL ratio has gained strength for the past 10 weeks according to the number of new highs versus the number of new lows and is looking like a similar pattern to 2005.
Monday had a total of 636 new highs, the most new highs in one day since Monday, May 5, 2006 when the daily ratio closed at 745-38. The ratio continues to gain strength and individual leaders are moving higher (stocks on our MSW Index and the IBD 100) but many secondary indicators are suggesting that the market is still extended. The main secondary indicator that I follow is the number of stocks trading above their 50-day moving average on the S&P 500. It closed at 80.80% after reaching an intra-week high of 85.20%, the highest reading since the January 2006. The market didn’t peak for another four months after reaching the level above 80% in January and this is why the indicator remains secondary. When the NASDAQ finally turned, the percentage of stocks above their 50d- m.a. was closer to 65% in early May (it dropped below 50% the following week while the market took a plunge).
To calculate the percentage correctly, use this formula:
(New Highs – New Lows) / (New Highs + New Lows) * 100 = X%
Where do the Major Indexes stand in 2006?
NASDAQ: +6.21%
DOW: +11.99%
NYSE: +12.23%
S&P 500: +9.64%
Below is an updated look at the weekly averages for the NH-NL Ratio:
Saturday, January 14, 2006: 500-32
Saturday, January 21, 2006: 348-46
Saturday, January 28, 2006: 516-46
Saturday, February 4, 2006: 449-44
Saturday, February 11, 2006: 229-57
Saturday, February 18, 2006: 306-42
Saturday, February 25, 2006: 420-36
Saturday, March 04, 2006: 399-49
Saturday, March 11, 2006: 162-84
Saturday, March 18, 2006: 459-53
Saturday, March 25, 2006: 312-52
Saturday, April 01, 2006: 441-39
Saturday, April 08, 2006: 481-58
Saturday, April 15, 2006: 150-103
Saturday, April 22, 2006: 540-75
Saturday, April 29, 2006: 353-76
Saturday, May 6, 2006: 503-74
Saturday, May 13, 2006: 384-116
Saturday, May 20, 2006: 64-211
Saturday, May 27, 2006: 57-182
Saturday, June 3, 2006: 119-93
Saturday, June 10, 2006: 72-204
Saturday, June 17, 2006: 41-310
Saturday, June 24, 2006: 56-238
Saturday, July 01, 2006: 127-198
Saturday, July 08, 2006: 143-95
Saturday, July 15, 2006: 74-273
Saturday, July 22, 2006: 66 – 307
Saturday, July 29, 2006: 163-151
Saturday, August 5, 2006: 194-132
Saturday, August 12, 2006: 88-210
Saturday, August 19, 2006: 178-96
Saturday, August 26, 2006: 140-74
Saturday, September 2, 2006: 285-42
Saturday, September 9, 2006: 143-60
Saturday, September 16, 2006: 244-75
Saturday, September 23, 2006: 206-83
Saturday, September 30, 2006: 251-75
Saturday, October 7, 2006: 301-92
Saturday, October 14, 2006: 412-40
Saturday, October 21, 2006: 442-29 – This Week
Tuesday, September 19, 2006
NH-NL Ratio still Neutral
Monday, September 04, 2006
Looking at the Market through the NH-NL Ratio
Monday, August 14, 2006
New Highs and New lows telling a Story
Piranha


Speak Your Mind