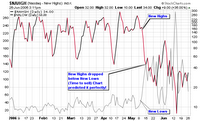
 I dedicated a portion of this past Saturday’s weekly analysis to the NH-NL ratio; so I wanted to highlight the added chart that tracks the NASDAQ new highs and new lows at stockcharts.com. My weekly NH-NL ratio is compiled from IBD and stretched further than just the NASDAQ.
Prior to Today (Monday, June 26, 2006), the NH-NL ratio has closed in negative territory for 28 of the past 30 days, the longest streak over the past several years (since the bear market). The previous long streak from 2005 lasted 13 days during the month of October when we had three consecutive negative weeks. We have now had 15 consecutive negative days ending this past Friday, the weakest in years. Five of the past six weeks have been negative for the longest stretch of weakness since MSW has been publishing screens in early 2004. This is the longest negative NH-NL ratio streak since late 2001 and early 2002. With all of this weakness, I am amazed at how well the markets have held up compared to the bubble burst of 2000 and the strong bear market that lasted for a couple years from 2000-2002. This can only mean two things: the market still has more downside or the market has strength that will eventually show up with the DOW possibly making a new all-time high and the NASDAQ moving to new 52-week highs. Wow, I guess anyone can predict that (I took both sides of the coin).
Whatever is in store for us, we must follow the rules and wait patiently until the NH-NL ratio returns to positive territory, the market highlights new individual leaders and the major indexes recover their long term moving averages. Until all of this happens, I will remain in cash with a few long-term option positions. Even though I added several new names to the MSW Index, it remains strictly a watch list at this time.
Below is an updated look at the weekly averages for the NH-NL Ratio:
Saturday, January 14, 2006: 500-32
Saturday, January 21, 2006: 348-46
Saturday, January 28, 2006: 516-46
Saturday, February 4, 2006: 449-44
Saturday, February 11, 2006: 229-57
Saturday, February 18, 2006: 306-42
Saturday, February 25, 2006: 420-36
Saturday, March 04, 2006: 399-49
Saturday, March 11, 2006: 162-84
Saturday, March 18, 2006: 459-53
Saturday, March 25, 2006: 312-52
Saturday, April 01, 2006: 441-39
Saturday, April 08, 2006: 481-58
Saturday, April 15, 2006: 150-103
Saturday, April 22, 2006: 540-75
Saturday, April 29, 2006: 353-76
Saturday, May 6, 2006: 503-74
Saturday, May 13, 2006: 384-116
Saturday, May 20, 2006: 64-211
Saturday, May 27, 2006: 57-182
Saturday, June 3, 2006: 119-93
Saturday, June 10, 2006: 72-204
Saturday, June 17, 2006: 41-310
Saturday, June 24, 2006: 56-238 – This Past Week
As for new highs vs. new lows – here are the facts from last Week:
Monday showed a ratio of 59-240
Tuesday showed a ratio of 43-278
Wednesday showed a ratio of 64-192
Thursday showed a ratio of 59-227
Friday showed a ratio of 53-253
Another thing that I noticed on a combo chart (I first noticed this by Matthew Frailey) was the possible switch of favor from small caps to large caps in recent weeks. As you can see from the second chart (which tracks large caps versus small caps), large caps are starting to gain some strength by violating the trend line that dates back several years to the bubble burst. This is a secondary indicator that can be helpful but never use it alone or as a decision maker without first reviewing the price and volume of the market and the NH-NL ratio.
Piranha


Speak Your Mind