Over the past month we have seen the NH-NL (new high – new low) ratio gather strength briefly, only to falter this week. The ratio ending on Saturday, January 14, 2005 gave us a weekly average of 500 new highs, the first time we topped this mark since last July. The month of October averaged 136 new highs per day, November averaged 240 new highs per day and December averaged 305 new highs per day (excluding the holiday shortened week). We saw the up-trend coming by watching this indicator and the price and volume of the major market indices. Following the leading stocks allowed us to place positions before the crowd started to realize a mini-bull run was underway.
Heading into today’s action, we are looking at a weekly new high average near 321 stocks per day. If Friday’s action stays in line with the current weekly average, we will drop to the lowest levels of 2006, stepping down more than 180 new highs per day from last week. I am not turning bearish because the ratio is far from turning negative, a situation we have not seen since the final week of October when the NH-NL ratio closed at 111-162. One of the worst weeks of last year came in mid October when the ratio ended at 46-317 on October 15, 2005 (a far cry from last week’s 500-32).
The market reversed the bear trend yesterday with a strong showing of leadership, giving us 471 new high with many of the MSW Index stocks making large gains. As a group, the 28 stocks moved up over 2%, regaining the entire 1.25% loss from the previous day. Yesterday is long gone though because today we are getting beat down with sharp losses across the board as GE and Citigroup break the DOW. As of 12:30pm Friday, twenty of the twenty eight MSW stocks are showing a loss with (AAPL) and (GMXR) leading the way (two of our best stocks over the past six months). I could care less about the leading DOW stocks as I focus intently on my personal holdings and the remainder of the MSW Index. When they are falling, I know the market is having a bad day or making a correction.
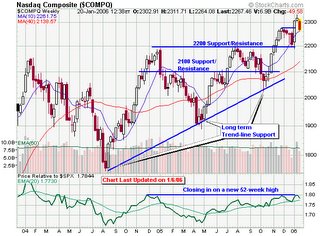
Looking at the NASDAQ chart below, you can see how the index is challenging the recent breakout level and the 50-d moving average. Looking at the price relative to the S&P 500, we can see that the NASDAQ has been struggling to break above the resistance line for the past three months. If the 50-d m.a. is sliced, I will be looking back down to the long term support at 2,200. Stay tuned to see how the markets close this afternoon and what the final NH-NL ratio will be later today.


Speak Your Mind