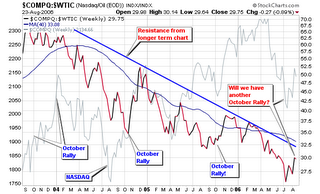
I posted up a chart looking at the relationship between the NASDAQ and crude oil contracts a couple months back in an entry titled “Can the NASDAQ – Crude Oil Index predict Bulls & Bears”.
The combo index highlighted the relationship of the two indexes and actually told us on a higher level when and where the market was making rallies or starting major down trends over the past 10 years. Visit the link above for a further description of the actual combo index.
As this year moves on, I have noticed that the combo index continues to reach new multi-year lows while traveling below its 200-d moving average. Recently, it started to move north but still lives beneath the moving average and long term trend-line or resistance. I am still wondering if this index is useful and if it can confirm a sustainable rally if it crosses back above the 200-d m.a. and multi-year resistance line.
While reviewing the three year chart, I noticed the spikes in October and was wondering if it will do the same this year since the action is starting to resemble previous years (post bubble burst era). Whatever the case, it will be very interesting to see many indicators move to the positive side simultaneously all confirming a possible rally towards the end of this year. The Stock Trader’s almanac states that mid-term election year lows usually peak 50% higher in the following 6-12 months. We are now in a mid-term election year and several indicators look to be hitting bottoms with an urge to move higher.
So I ask:
Will the NASDAQ be 50% higher in six to twelve month from this year’s bottom?
Only time will tell and I will not know the answer until my most important indicators give me the green light signal to buy heavy on the long side!
Piranha


Speak Your Mind